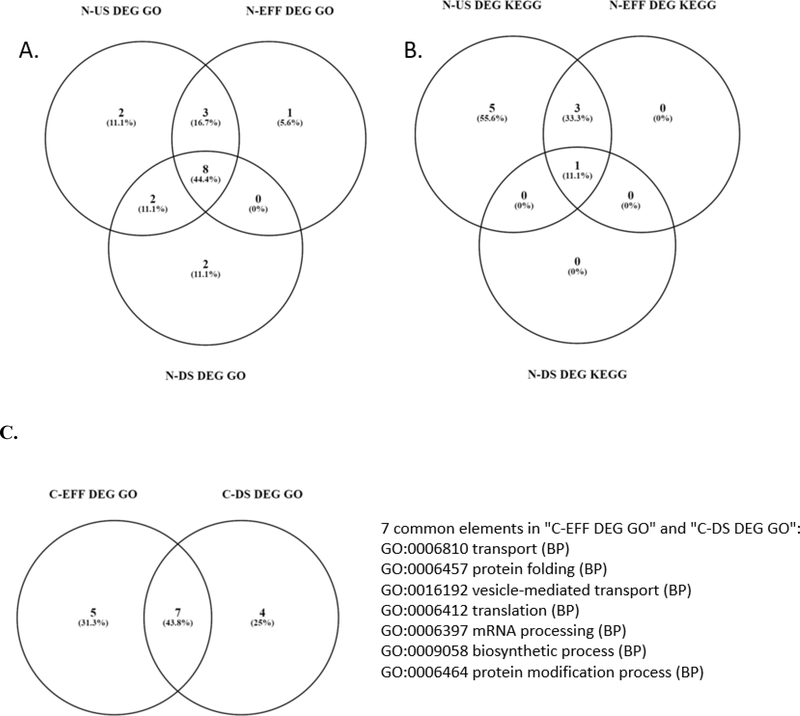
Figure 3 –
Venn diagrams showing the overlap in biological process (BP) gene ontology (GO) terms or Kyoto Encyclopedia of Genes and Genomes (KEGG) pathway annotation terms identified as enriched among the differentially expressed genes identified for the hepatic transcriptome at each site. [A.] Numbers of overlapping biological process GO terms for N stream sites. [B.] Numbers of overlapping KEGG pathway annotation terms for N stream sites. [C.] Number of overlapping biological process GO terms for C stream sites, along with identification of the overlapping terms.

