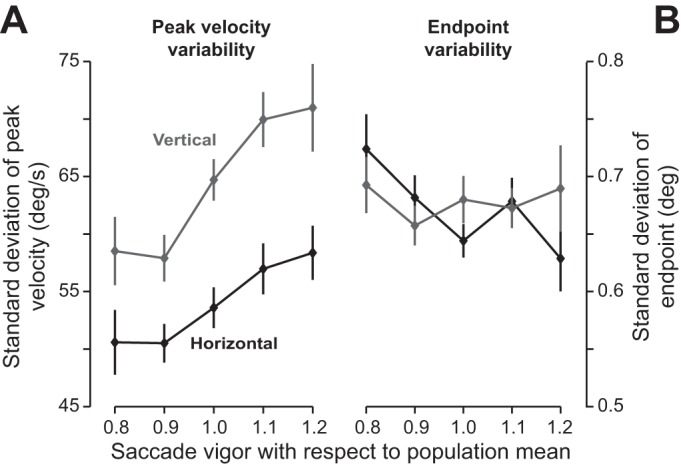
Fig. 4.

Vigor of saccades and end-point variance. A: SD of peak velocity of saccades vs. vigor of saccades. For each subject, we calculated the SD of peak velocity separately for horizontal and vertical saccades. Across subjects, the SD of peak velocity tended to increase with saccade vigor. Error bars are SE. B: SD of saccade end point vs. vigor of saccades. For each subject, we fitted Eq. 7 to the relationship between saccade displacement and target displacement. We then calculated the variance-covariance matrix of the 2-dimensional saccade displacement residual. The square root of the trace of this matrix was our proxy for end-point variability. Saccade vigor appeared to be unrelated to end-point variability.
