Fig. 9.
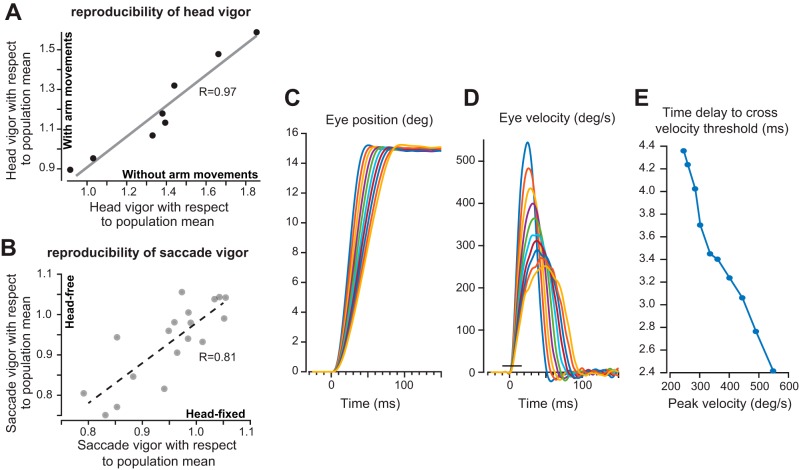
Control studies. A: reproducibility of head vigor: head vigor as measured during a task that included arm movements and a task that did not include arm movements. Each point is a single subject. Individuals who moved their head with high vigor in the context of arm movements also tended to move their head with high vigor without accompanying arm movements (R = +0.97). Vigor data are with respect to the population mean acquired during experiment 2 (head-free gaze shifts with arm movements). B: reproducibility of saccade vigor. Saccade vigor was measured in head-fixed and head-free conditions. Each point is a single subject. Individuals who moved their eyes with high vigor in the head-fixed condition also tended to move their eyes with high vigor in the head-free condition (R = +0.81). Vigor data are with respect to the population mean acquired during experiment 1 (head-fixed saccades). C: the bias produced by using a velocity threshold to estimate the reaction time. Simulated eye position traces for 15° saccades with various peak velocities. D: velocity traces for the simulated saccades. The horizontal line near saccade onset shows the velocity threshold used for detecting movement onset. This is the same threshold that was used in detecting movement onset in our experiments. E: as saccade velocity increases, the time delay from simulated movement onset to detected onset decreases. The magnitude of this effect is ∼2 ms.

