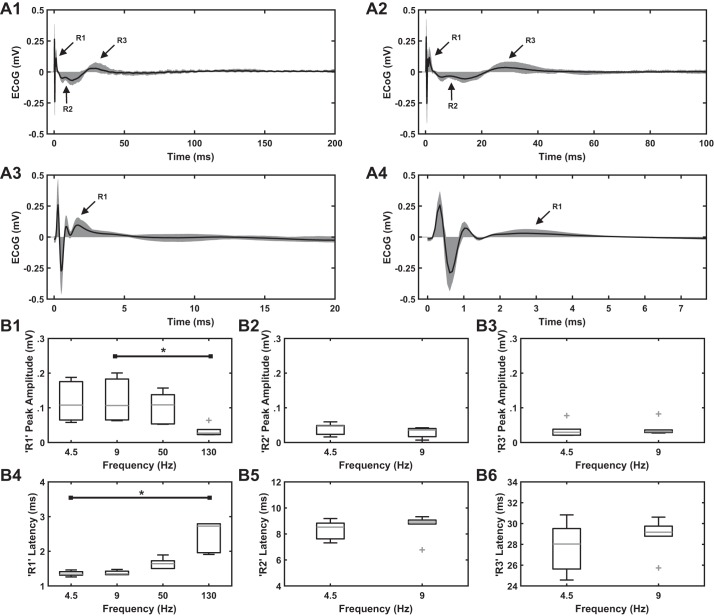
Fig. 4.
A: effect of subthalamic nucleus (STN) deep brain stimulation (DBS) frequency on the cortical evoked potential (cEP) response in healthy awake rats (n = 6). A1: 4.5 Hz. A2: 9 Hz. A3: 50 Hz. A4: 130 Hz. Stimulation parameters for electrocorticographic (ECoG) recordings: charge-balanced, symmetric biphasic pulses with a duration of 90 µs/phase and an amplitude range of 30–75 µA. STN DBS at low frequencies (4.5 and 9 Hz) evoked R1, R2, and R3 responses. High-frequency STN DBS (50 and 130 Hz) evoked an R1 response. Shading shows the range of cEP responses across rats, whereas black trace shows the mean cEP response across rats. B: quantification of cEP response features (peak amplitude and latency of peak amplitude) across STN DBS frequencies. On each box, the central mark indicates the median and bottom and top edges of box indicate the 25th and 75th percentiles, respectively. Whiskers extend to 1.5 times the interquartile range, and plus sign indicates outliers. B1, B2, and B3: peak amplitude of R1, R2, and R3 responses at different STN DBS frequencies. Absolute values were used in the case of R2 peak amplitude. Note a decrease in R1 peak amplitude at 130 Hz compared with lower frequencies. Friedman’s ANOVA identified effects of stimulation frequency on R1 peak amplitude (P = 0.011). B4, B5, and B6: latency of peak amplitude of R1, R2, and R3 responses at different STN DBS frequencies. Again, note an increase in the latency of peak amplitude of R1 response at higher compared with lower frequencies. Friedman’s ANOVA identified effects of stimulation frequency on the latency of R1 response (P = 0.002). *P < 0.05, significant difference between DBS frequencies (Dunn-Bonferroni method).

