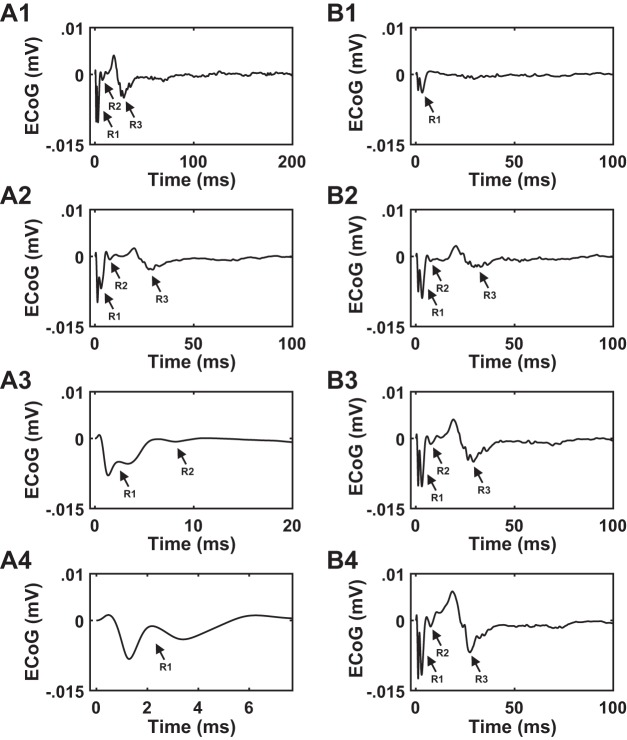
Fig. 11.
A: model-based cortical evoked potential (cEP) response to different subthalamic nucleus (STN) deep brain stimulation (DBS) frequencies with activation of 60% of layer 5 (L5) axons. A1: 4.5 Hz. A2: 9 Hz. A3: 50 Hz. A4: 130 Hz. Model-based cEP response matched exceeding well with the in vivo response shown in Fig. 4. Note the reversal in polarity of cEP phases in model-based response compared with the in vivo cEP response shown in Fig. 4. B: effect of 4.5-Hz STN DBS intensity simulated by modulating the proportion of L5 pyramidal neuron axon activation. B1: 20%. B2: 40%. B3: 60%. B4: 80%. Note the magnitude of all phases (R1, R2, R3) increased and became more prominent at higher levels of activation. ECoG, electrocorticographic recordings.

