
Fig. 4.
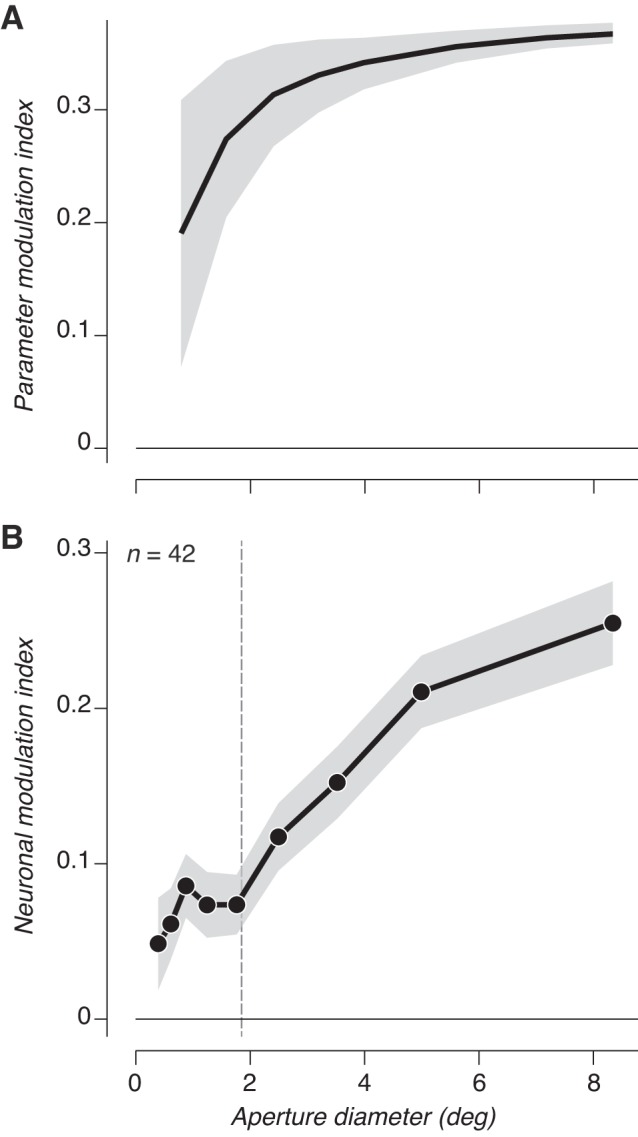
Stimulus statistics do not account for changes in sensitivity with size. A: parameter modulation index between naturalistic and spectrally matched noise stimuli computed from higher order parameters as a function of stimulus aperture. Shaded regions indicate average variance across samples. B: average neuronal modulation index from V2 responses as a function of stimulus aperture. The average classical receptive field (CRF) size is plotted as a dashed vertical line, but CRF sizes were ignored in computing the average modulation index. Shaded region represents ±SE across conditions.