
Fig. 7.
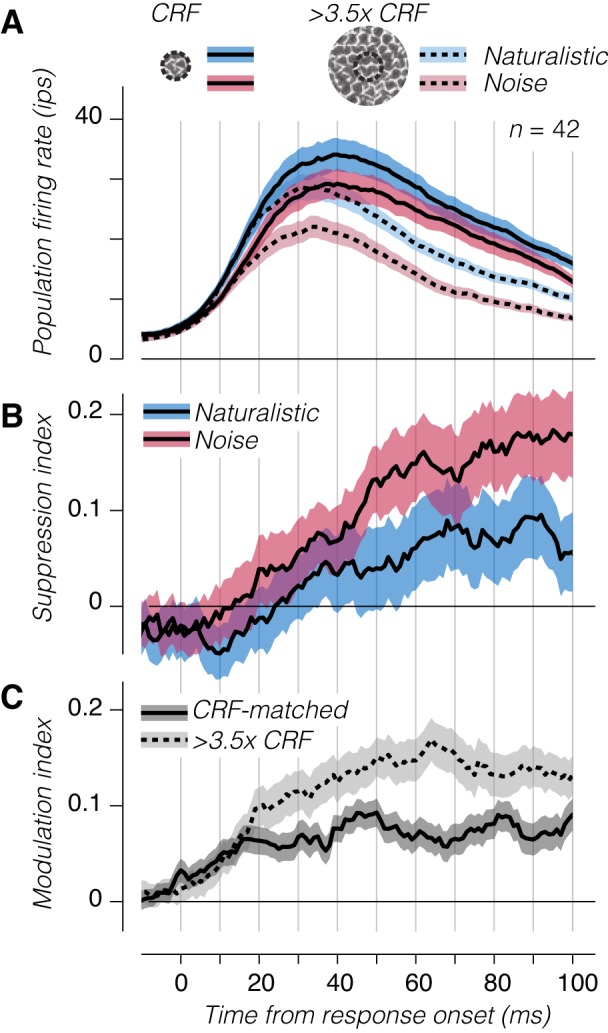
Temporal dynamics of suppression and sensitivity across the V2 population. A: average population firing rate of V2 neurons to large and small patches of naturalistic or spectrally matched noise. The response of each neuron was aligned to its estimated response onset. B: normalized suppression as a function of time from response onset for naturalistic and spectrally matched stimuli. C: modulation index as a function of time for classical receptive field (CRF)-matched and large stimuli. Shaded regions represent ±SE across experiments; ips, impulses/s.