
Fig. 9.
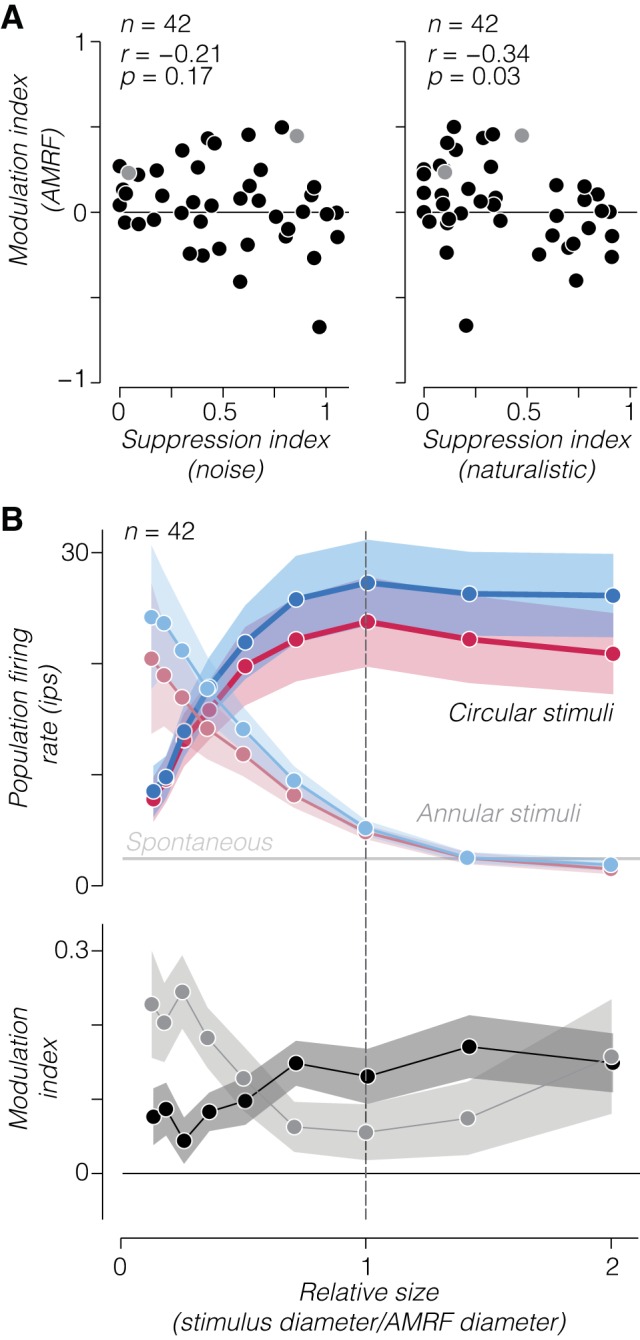
Dissociation of surround suppression strength from naturalistic sensitivity to annular stimuli. A: scatterplot of the modulation index measured from annular stimuli matched to the annular minimum response field (AMRF) of each V2 neuron against surround suppression to noise (left) and naturalistic (right) stimuli. Lighter shaded symbols in each panel correspond to the 2 example neurons in Fig. 8, A and B. B: average population firing (top) and modulation index (bottom) as a function of relative size of annulus inner diameter (light shading) and circular aperture diameter (dark shading) for all V2 neurons. Tuning curves were aligned to each neuron’s estimated AMRF. In top panel, gray horizontal line represents mean population spontaneous firing rate. Dashed vertical line represents the estimated AMRF. Shaded regions represent ±SE across neurons; ips, impulses/s.