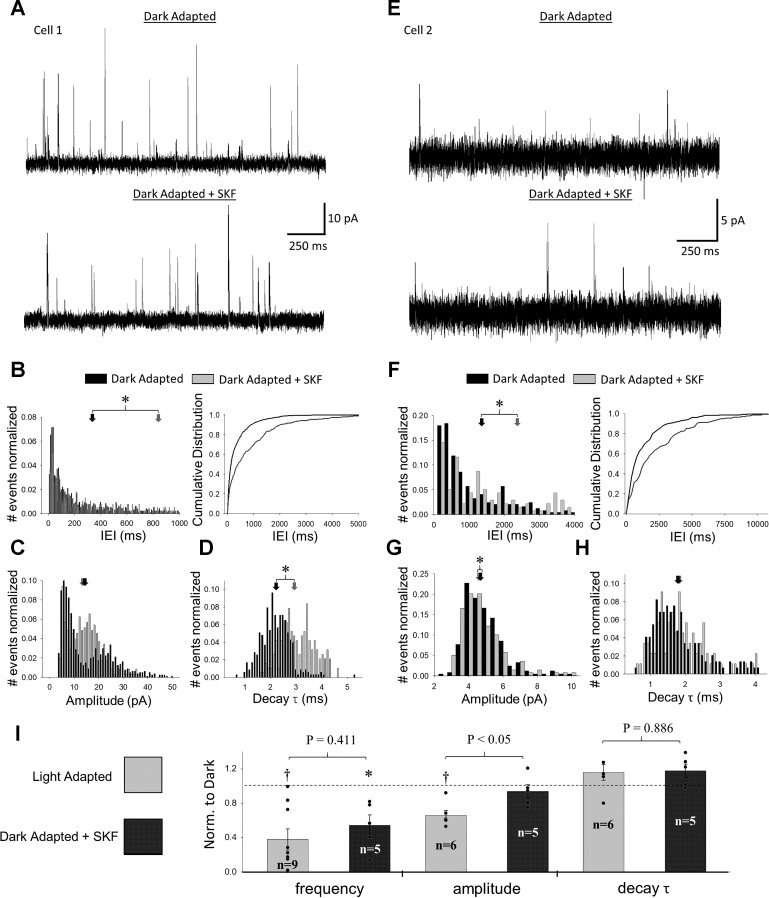
Fig. 3.
Activation of D1 receptors decreases frequency and modifies distributions of spontaneous inhibitory postsynaptic currents (sIPSCs) in rod bipolar cells. A: example traces of spontaneous currents in the same cell before (top) and after (bottom) application of SKF-38393 (SKF). For each condition, 2 traces are shown (1 in black and the other in gray). B–D: interevent interval (IEI) (B), amplitude (C), and decay τ (D) distributions of sIPSCs from the same cell as in A before (black) and after (gray) application of SKF. For all distributions, the number of events in each bin was normalized to the total number of events per condition. Arrows represent average dark-adapted (black) and SKF-treated (gray) values for this cell. B: IEI histogram (left) with cumulative distribution function (right) included for clarity. sIPSCs showed significant shifts toward larger IEIs after SKF for 5 out of 5 cells tested (Kolmogorov-Smirnov; K-S, P < 0.05). C: for 3 out of 5 cells tested, SKF caused a significant shift in sIPSC amplitudes away from small and large values toward intermediate ones (K-S, P < 0.05). D: for these same 3 cells, SKF caused an increased shift in decay τ (K-S, P < 0.05). E–H: same as for A–D but for a different cell. In this case, a significant shift in IEI is apparent, but the amplitude distribution changes only marginally. Additionally, no significant shift in decay τ occurs. I: comparison of average sIPSC frequency, amplitude, and decay τ between dark-adapted, SKF, and light-adapted states. All data were normalized to dark-adapted values (represented by dashed line) before averaging. Light adaptation caused significant declines in both frequency and amplitude compared with dark-adapted conditions (paired t-test, P < 0.05), whereas SKF only caused a significant decline in frequency (paired t-test, P = 0.0216). Average values for individual cells within each group are represented by black dots. P values shown represent unpaired t-tests between SKF and light-adapted sIPSCs. *Paired t-test, P < 0.05 dark-adapted condition vs. SKF; †paired t-test, P < 0.05 dark-adapted vs. light-adapted conditions. Cell numbers (n) for t-tests in I are shown.

