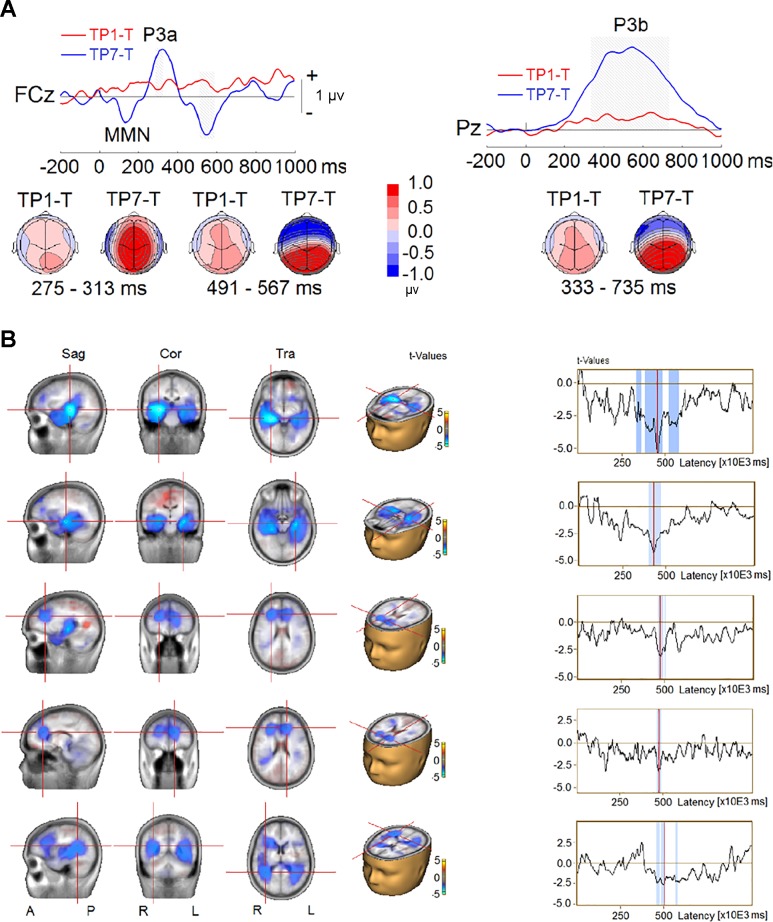
Fig. 10.
Event-related potential (ERP) difference waves from TP1–T (ERP waves elicited by sequences containing target and probe at +1 position minus ERPs elicited by sequences with target only) and TP7–T (ERP waves elicited by sequences containing target and probe at +7 position minus ERPs elicited by sequences with target alone) contrasts in experiment 2. A, top: group-mean difference waves at a midline frontocentral electrode (FCz) and a midline parietal electrode (Pz). Gray shading represents the time intervals of the difference between TP1–T and TP7–T to reach significance. Bottom, topographies of ERP difference during the time intervals. MMN: mismatch negativity. B, left: difference in source activity. Right, time series of difference in source activity, where blue shading represents time intervals of the difference between TP1–T and TP7–T to reach significance. Sag, sagittal; Cor, coronal; Tra, transverse; A, anterior; P, posterior; R, right; L, left.

