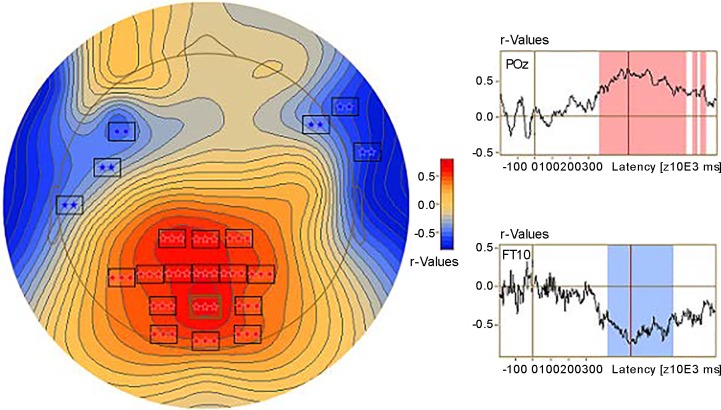
Fig. 13.
Correlation between event-related potentials elicited by the probe and probe discrimination accuracy in the attentional blink (AB) condition. Left, scalp distribution of the correlation. Squares represent electrodes to reach significance: **P < 0.01; ***P < 0.001. Right, time series of correlations at a parietal-occipital electrode (POz) and a frontotemporal electrode (FT10). Red and blue shading represents time intervals of the correlations to reach significance, where red indicates positive correlation and blue indicates negative correlation.

