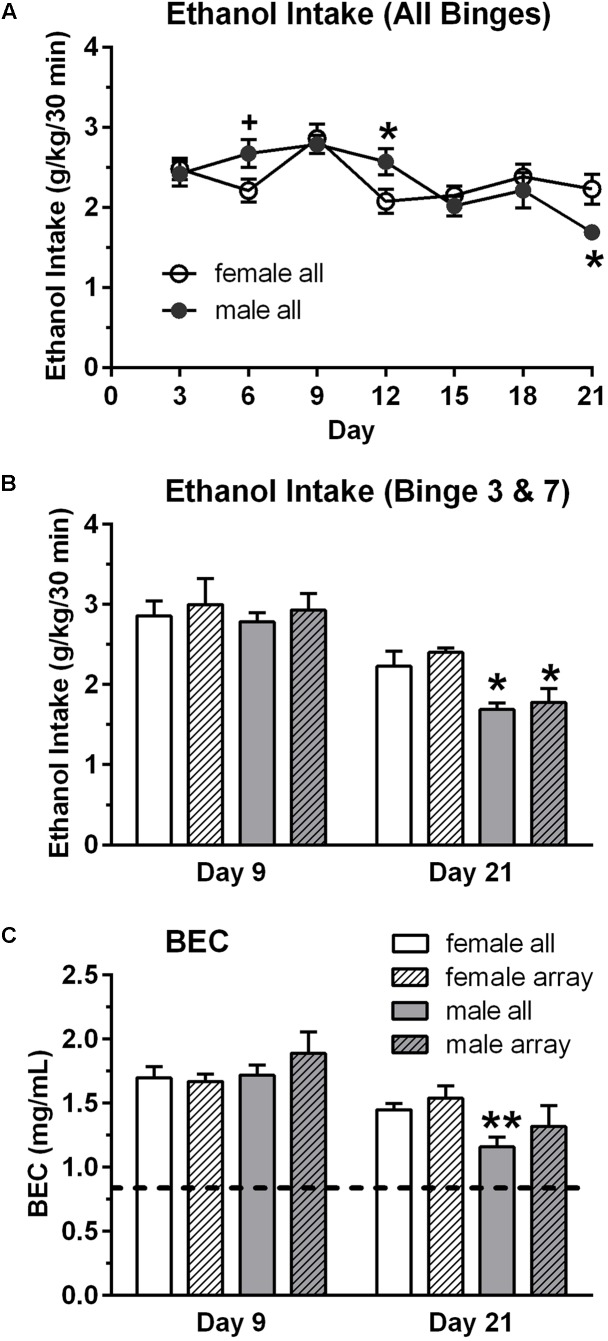
FIGURE 1.
Binge ethanol intake (A,B) and blood ethanol concentration (BEC, C) in male and female mice. Mice in the binge groups had a total of seven binge drinking sessions, with a binge session every 3rd day (A). BEC was measured at the end of the 3rd (day 9) and 7th (day 21) binge sessions. Although overall binge ethanol intake, averaged across the seven sessions, did not differ in the female (2.34 g/kg) and male (2.35 g/kg) mice, ethanol intake and corresponding BECs were lower in the male vs. female mice on the final binge session (day 21, B,C). However, BECs greatly exceed the criteria for binge drinking on all days (0.80 mg/mL; depicted by dashed line in C). Shown are mean ± SEM for all mice in the binge groups (n = 9/sex), which included the mice in the subgroup that were used for the qRT-PCR analysis (n = 4/sex), and for the mice in the subgroup that were used for the qPCR arrays (n = 3/sex). +p = 0.06, ∗p < 0.05, ∗∗p < 0.01 vs. respective female all or female array group.

