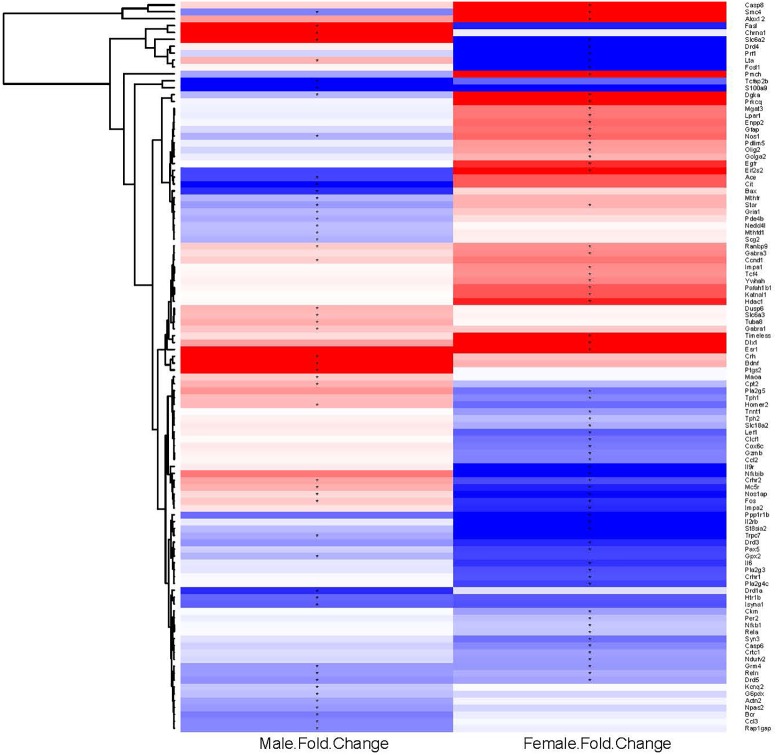
FIGURE 2.
Heat map and hierarchical cluster analysis of genes significantly regulated by repeated binge drinking in male and female mice. All significantly regulated genes (106 total) were used to generate the heat map and to perform the cluster analysis to visualize the transcriptional response at 24 h after the 7th binge ethanol drinking session. Each column represents the combined data from six arrays (three binge, three control), with the binge ethanol-induced change in expression shown for males and females in separate columns. Shades of color indicate up-regulation (red) or down-regulation (blue) for a particular gene following binge drinking. Hierarchical cluster analysis was performed on the ethanol regulated genes. Genes (represented by rows, names at the right of the image) were clustered according to the similarity of expression profile as the result of repeated binge drinking. Clustering of genes emphasizes the sexually dimorphic response to repeated binge drinking experience. ∗p < 0.05 for significantly regulated genes (binge vs. control).

