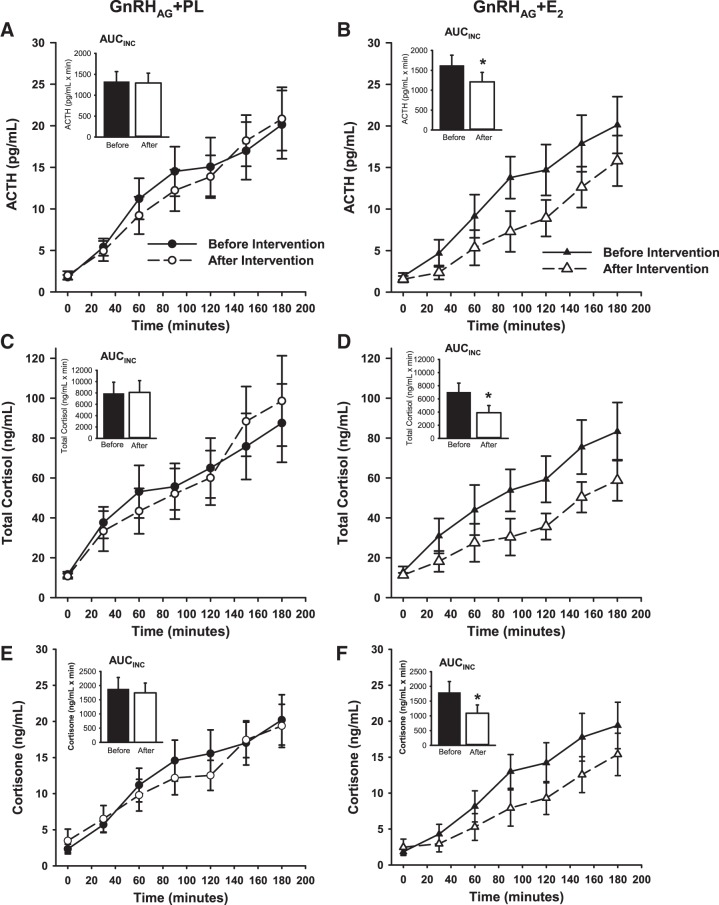
Fig. 1.
ACTH, total cortisol, and cortisone response to a Dex/CRH stimulation test before and after 20 wk of GnRHAG with placebo (PL) or estradiol (E2) add-back therapy in premenopausal women. Mean response to CRH stimulation (1 µg/kg body wt; Acthrel, corticorelin ovine triflutate for injection) under Dex suppression (1 mg at 2300). Testing occurred at 0800 with baseline blood drawn at T-5 before intravenous administration of CRH. ACTH (A and B), total cortisol (C and D), and cortisone (E and F) were measured at each time point before (solid line and closed symbol) and after (dashed line and open symbol) 20 wk of GnRHAG therapy with add-back of PL (A, C, and E) or transdermal E2 (B, D, and F). Inset graphs represent incremental area under the curve (AUCINC) as calculated by the trapezoidal method with baseline set at T-5 for each data set. *P ≤ 0.02 vs. baseline. n = 15 participants per group. Data presented as means ± SE. ACTH, adrenocorticotropic hormone; CRH, corticotropin-releasing hormone; Dex, Dexamethasone; GnRHAG, gonadotropin-releasing hormone agonist; SE, standard error.

