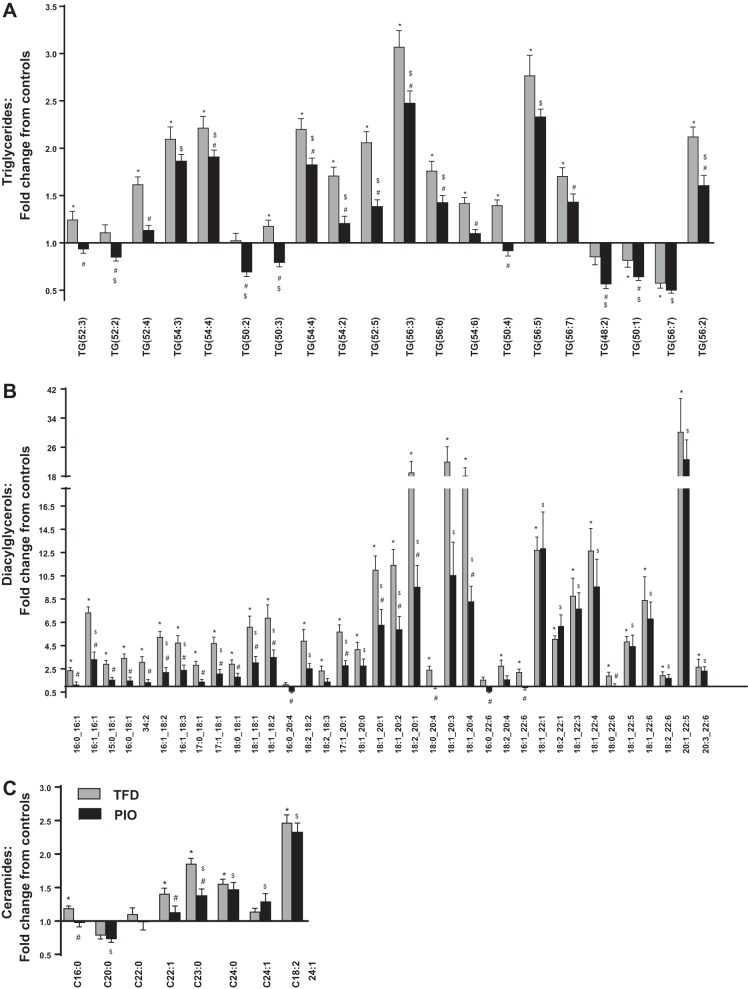
Fig. 4.
High-resolution LC-MS/MS-based lipidomic profiling of (A) triglycerides, (B) diacylglycerols, and (C) ceramides in the liver demonstrate significant changes in several of these lipid intermediates in the liver in response to pioglitazone administration in mice with NASH. Values for each bar are expressed as mean fold change from the control mice average ± SE (n = 6–8 per group). *P ≤ 0.05 between C and TFD; #P ≤ 0.05 between TFD and PIO; $P ≤ 0.05 between C and PIO.

