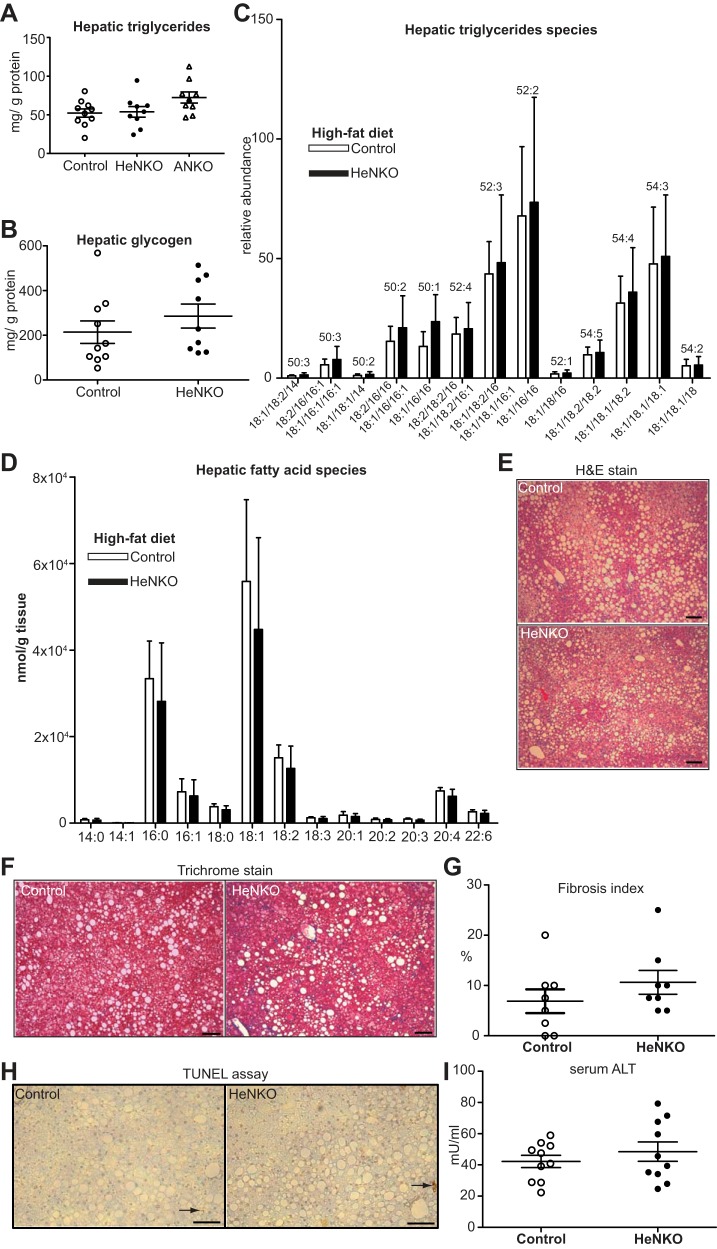
Fig. 6.
Liver glycogen, triglyceride contents, and histology in the hepatocyte-specific nuclear factor erythroid 2-related factor 2 (Nrf2) knockout mice on high-fat diet (HFD). A: hepatic triglyceride levels normalized to total protein levels in Control, Nrf2flox/flox::Albumin-Cre (HeNKO), and Nrf2flox/flox::Adipoq-Cre (ANKO) mice after 6 mo on HFD; n = 9–10 per genotype. Data are means ± SE. B: liver glycogen content normalized to total protein levels in Control and HeNKO mice; n = 9–10 per genotype. Data are means ± SE. C: hepatic triglyceride species measured by HPLC-mass spectrometry in Control and HeNKO mice after 6 mo on HFD; n = 8 per genotype. Data are means (SD). D: changes of fatty acid content in liver of Control and HeNKO mice after 6 mo on HFD determined by HPLC-electrospray ionization-tandem mass spectrometry; n = 8 per genotype. Data are means (SD). E: representative hematoxylin-eosin (H&E) stain of liver sections of Control and HeNKO mice after 6 mo on HFD. Scale bar: 100 μm. F: representative trichrome stain of liver sections of Control and HeNKO mice after 6 mo on HFD. Scale bar: 100 μm. G: relative fibrosis index (%) as pathologically assessed by trichrome-stained liver sections in Control and HeNKO mice after 6 mo on HFD; n = 8 per genotype. Data are means ± SE. H: representative images of terminal deoxynucleotidyl transferase dUTP nick end labeling (TUNEL) assay on liver sections of Control and HeNKO mice after 6 mo on HFD. Scale bar: 100 μm. Arrows indicate positive staining. I: serum alanine transaminase (ALT) concentration in serum of Control and HeNKO mice after 6 mo on HFD; n = 8 per genotype. Data are means ± SE.

