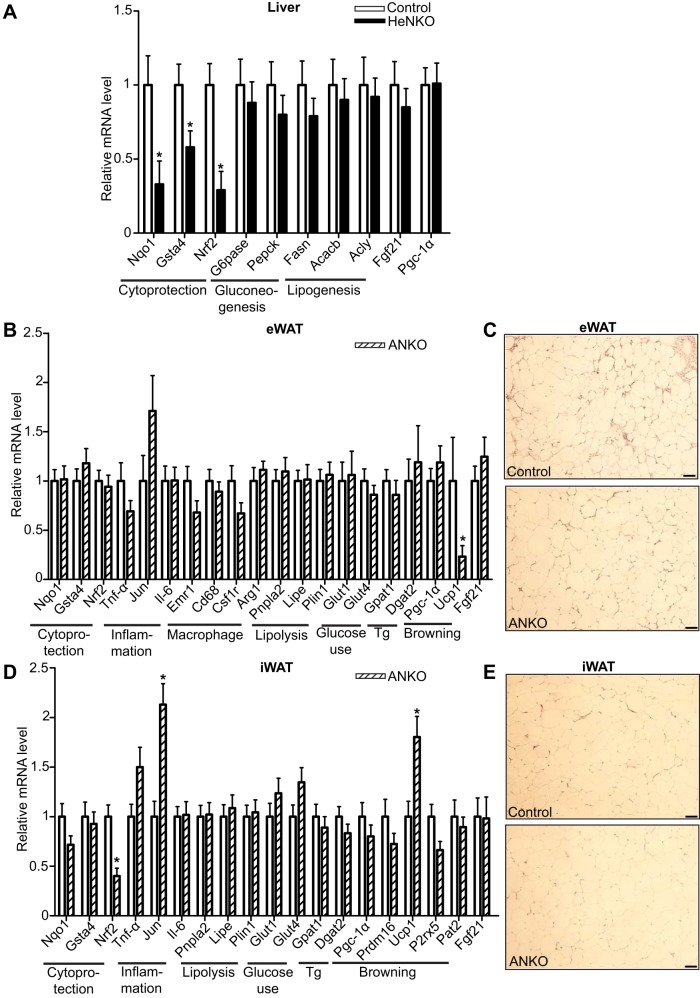
Fig. 7.
Gene expression analysis of liver and white adipose tissue in hepatocyte- and adipocyte-specific nuclear factor erythroid 2-related factor 2 (Nrf2) knockout mice, respectively. A, B, and D: mRNA levels of genes assessed by quantitative real-time PCR in livers of Control and Nrf2flox/flox::Albumin-Cre (HeNKO) mice (A) and in epididymal white adipose tissue (eWAT, B) and inguinal white adipose tissue (iWAT, D) in Control and Nrf2flox/flox::Adipoq-Cre (ANKO) mice after 6 mo on HFD; n = 11 for Control, n = 10 for HeNKO, and n = 9 for ANKO. Data are means ± SE. *P < 0.05. Tg, triglyceride synthesis. C and E: representative hematoxylin-eosin-stained sections (from a total of 6 checked per genotype) of eWAT (C) and iWAT (E) of Control and ANKO mice after 6 mo on HFD. Scale bar: 50 μm.

