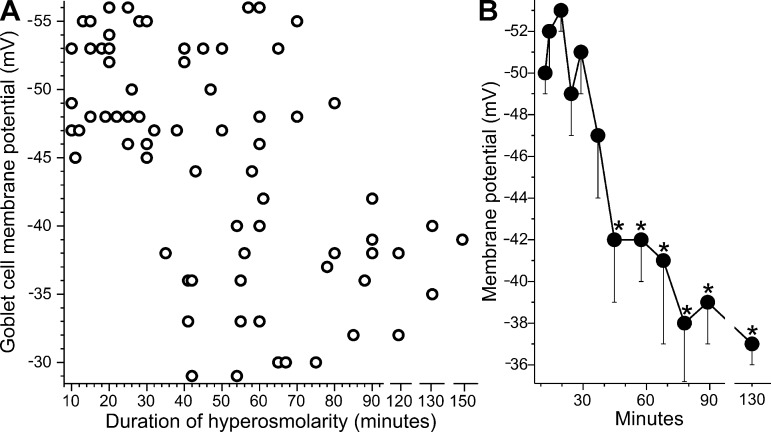
Fig. 7.
Duration of hyperosmolarity versus goblet cell voltage. A: resting membrane potentials of goblet cells located in freshly isolated rat conjunctival specimens exposed to the 360 mosM solution for 10 to 150 min. B: averages of 7 ± 1 sequential data points plotted at their mean sampling time. After 75 min in hyperosmotic solution, the mean membrane potential was not significantly different from the goblet cell voltage recorded in the 300 mosM solution (data in Fig. 2). *P ≤ 0.0001.

