Fig. 1.
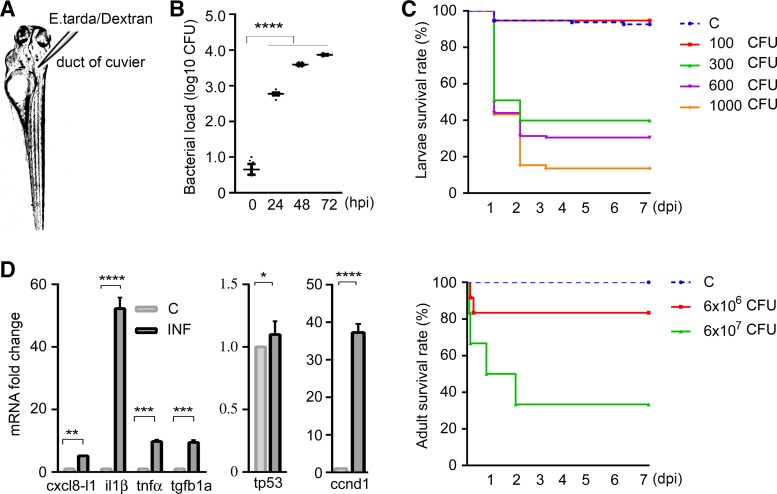
Evidence of systemic infection in zebrafish. A: larvae were injected in the duct of Cuvier at 3 days postfertilization. B: bacterial loads of zebrafish larvae over time. The scatterplot represents means ± SE. Numbers of colony-forming units (CFU) were calculated using homogenates of 5 larvae per sample, n = 6 samples per group. Significant differences were detected between controls and septic larvae at 24, 48, and 72 h postinfection. C: Kaplan-Meier curve of 7 days postinjection revealed dose-dependent mortality of both larval and adult zebrafish in response to Edwardsiella tarda injections. Sample size for larval groups: control, n = 281; 100 CFU, n = 118; 300 CFU, n = 330; 600 CFU, n = 312; 1,000 CFU, n = 202; for adult groups: control, n = 10; 6 × 10⁶ CFU, n = 12; 6 × 10⁷ CFU, n = 12. Compared with control animals, 100-CFU injections to larvae and 6 × 10⁶-CFU injections to adults had no significant impact on mortality, whereas larvae injected with ≥300 CFU and adults injected with 6 × 10⁷ CFU E. tarda exhibited significantly increased mortality. D: fold changes in mRNA expressions (presented as means ± SE) of inflammatory cytokines and stress response genes were estimated using samples containing homogenates of 50 larvae per sample, n = 4 samples per group. Significant differences were found between control and infected zebrafish larvae injected with 300 CFU E. tarda 1 day postinjection. C, control; ccnd1, cyclin D1; cxcl8-l1, zebrafish homolog of mammalian C-X-C motif chemokine ligand 8; dpi, days postinjection; hpi, hours postinjection; il1β, interleukin-1β; INF, infected; tgfb1a, transforming growth factor-β1a; tnfα, tumor necrosis factor-α; tp53, tumor protein p53. *P < 0.05, **P < 0.01, ***P < 0.001, ****P < 0.0001.

