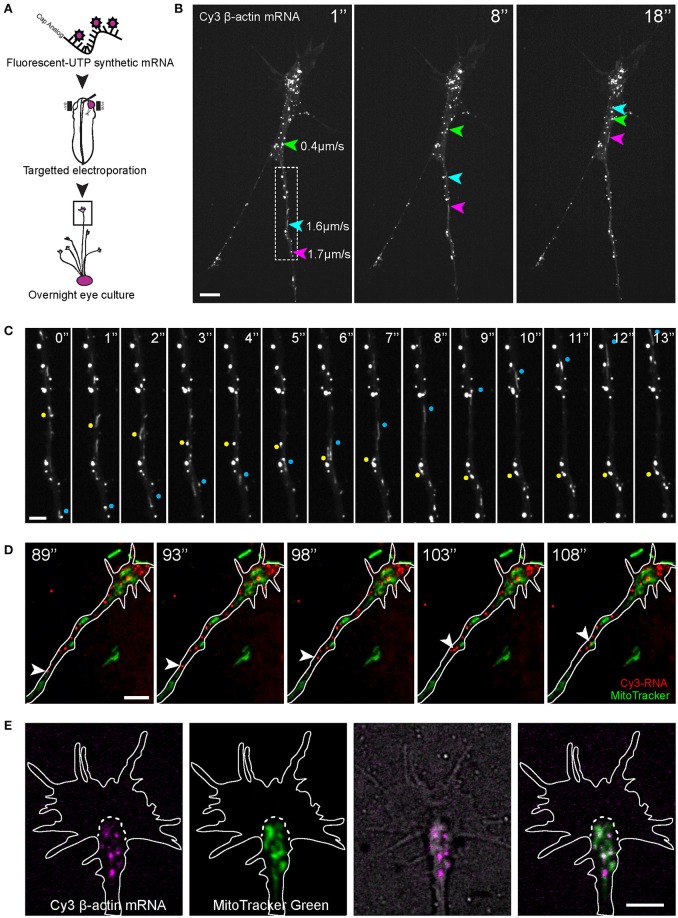
Figure 1.
Visualization of β-actin mRNA trafficking in axons. (A) Fluorescent β-actin mRNA was electroporated into stage 24–27 Xenopus embryo eye primordia. The electroporated eye primordia were dissected and cultured for live imaging. (B,C) The synthetic β-actin mRNA was observed as fluorescent granules in cultured RGC axons and growth cones. (B) Live imaging of β-actin mRNA granules revealed different modes of motion and a broad range of speed (arrows and arrowhead). (C) Both anterograde (blue dots) and retrograde (yellow dots) movements were present. (D) OMX imaging of endogenous RNA labeled globally with Cy3-UTP (Cy3-RNA) and mitochondria. (E) Within the growth cone the β-actin mRNA granules tended to concentrate in the organelle-rich central domain, as indicated by MitoTracker Green. Scale bars, 5 μm for (B,D,E) and 2 μm for (C). See also Figure S1.

