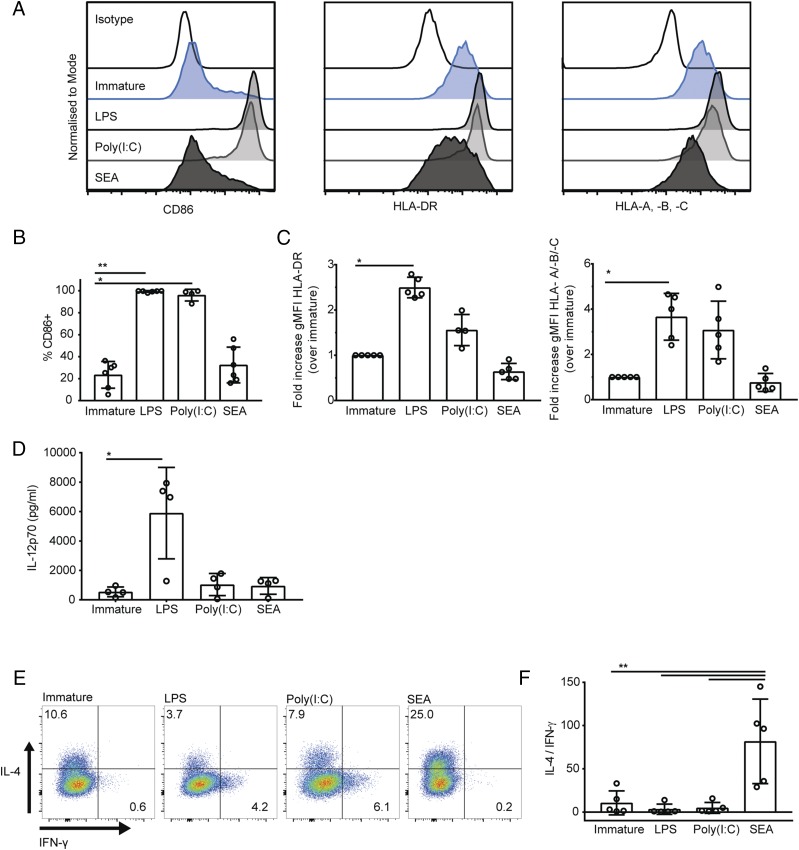
FIGURE 1.
DCs treated with SEA polarize Th2 responses in vitro. (A) Expression of CD86, HLA-DR, and HLA-A, -B, and -C on the surface of immature DCs (blue, second row) and DCs treated for 24 h with LPS (gray, third row), poly(I:C) (gray, fourth row), or SEA (black, bottom row) compared with isotype-matched control staining (top row). Data from one representative donor of six tested. (B) Percentage of DCs expressing CD86, comparing immature DCs and DCs treated for 24 h with LPS, poly(I:C), or SEA. (C) Fold change in gMFI of HLA-DR (left) and HLA-A, -B, and -C (right) in DCs after 24-h treatment with LPS, poly(I:C), or SEA, normalized to the level of expression in immature DCs. (D) Concentration of IL-12p70 in supernatants of immature DCs and DCs treated for 24 h with LPS, poly(I:C), or SEA. (E) IL-4 and IFN-γ production by CD4+ T cells stimulated with PMA and ionomycin after 13-d culture with treated DCs in the presence of staphylococcal enterotoxin B; dot plots from one representative donor (of five tested) gated on live singlet CD4+ T cells. (F) Ratio of IL-4–positive over IFN-γ–positive CD4+ T cells. In all plots, circles represent data points from individual donors and bars show mean (±SD) of four to six independent donors. *p < 0.05, ** p < 0.01, analyzed by Kruskal–Wallis test with Dunn multiple comparisons (B–D) and repeated measures one-way ANOVA with Tukey multiple comparisons (E).

