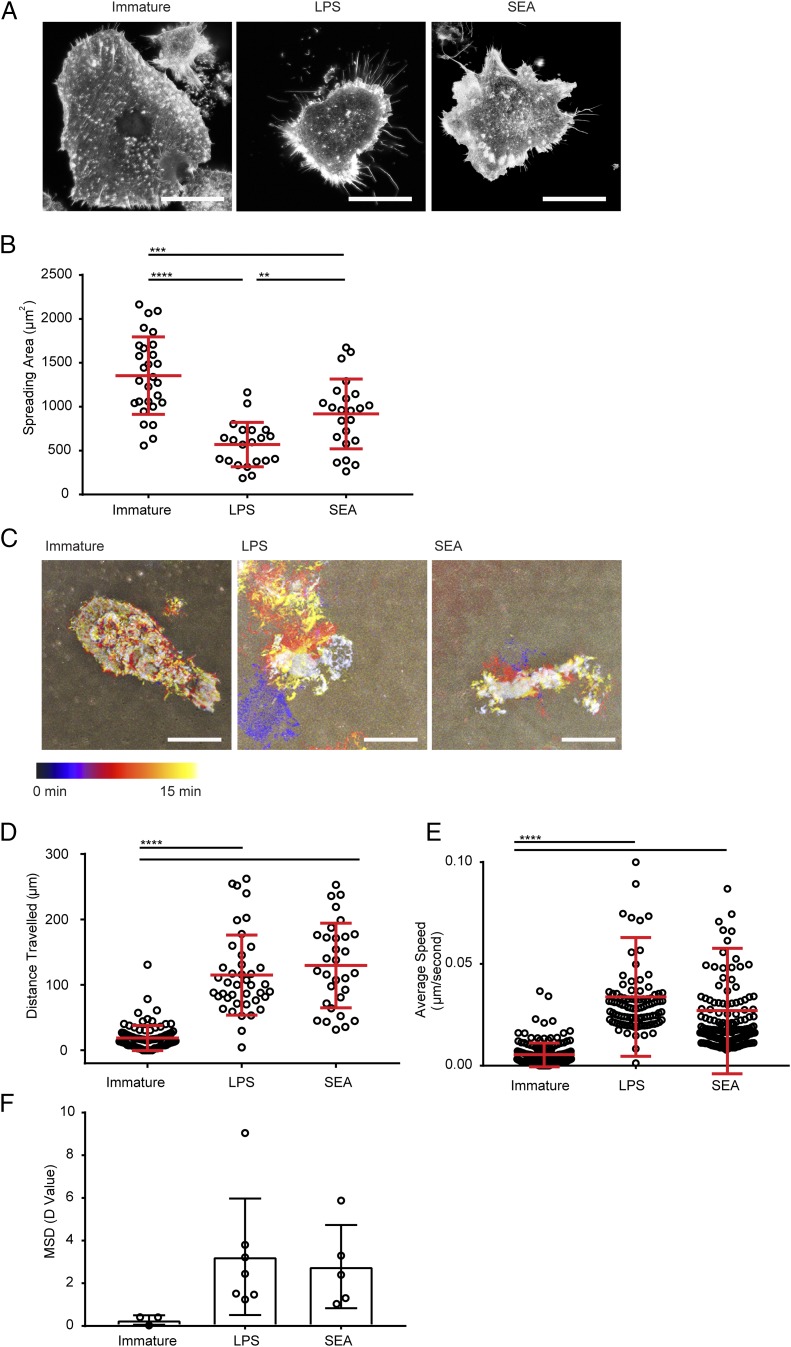
FIGURE 2.
DCs treated with SEA show distinct morphology and spreading behavior. (A) Fluorescent images of immature DCs or DCs treated for 24 h with LPS or SEA, incubated on 10 μg/ml fibronectin, and stained with AF488-labeled phalloidin (to mark F-actin). Representative from 50 images taken with three independent donors; scale bar, 20 μm. (B) Spreading area of DCs measured from images as in (A) pooled from three donors. (C) Time-lapse interference reflection microscopy (IRM) images of DCs spreading on 10 μg/ml fibronectin over 15 min. Images show differently silhouettes of the adherent membrane color coded by time. Data are representative of 8–10 images obtained with three independent donors. (D) Total distance traveled by immature DCs or DCs treated for 24 h with LPS or SEA, plated on 10 μg/ml fibronectin, and tracked by time-lapse imaging over 5 h. (E) Average migration speed of immature DCs or DCs treated for 24 h with LPS or SEA, plated on 10 μg/ml fibronectin, and tracked by time-lapse imaging over 5 h. (F) Mean squared displacement (MSD) diffusion coefficient values calculated from multiple tracks of immature DCs or DCs treated for 24 h with LPS or SEA and plated on 10 μg/ml fibronectin for 5 h. In (B), (D), and (E), circles represent data points from individual cells; lines show mean (±SD) of cells pooled from three independent donors. In (F), circles represent MSD of imaging regions from three independent experiments; bars show mean (±SD) analyzed by one-way ANOVA with Tukey multiple comparisons (no significant differences). **p < 0.01, ***p < 0.001, ****p < 0.0001, analyzed by one-way ANOVA with Tukey multiple comparisons (B) and Kruskal–Wallis test with Dunn multiple comparisons (D and E).

