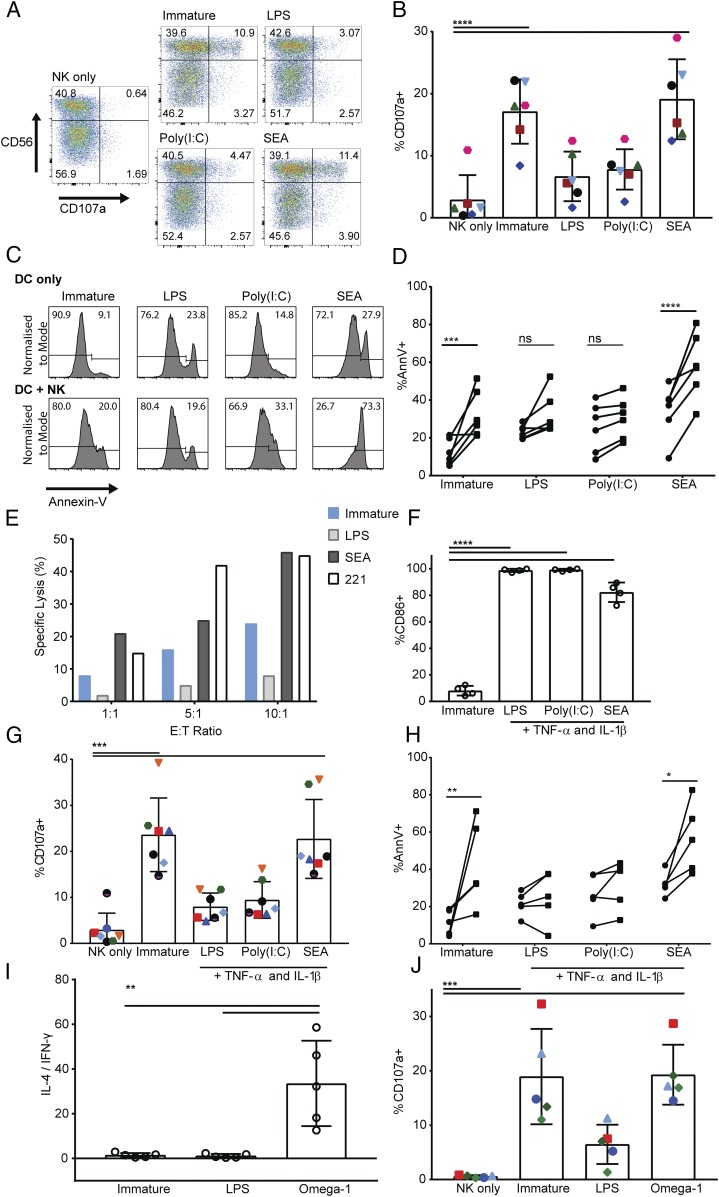
FIGURE 4.
NK cells induce apoptosis of DCs treated with SEA. (A) NK cell expression of CD107a after 5-h culture alone (NK only) or at a 1:1 ratio with immature DCs or DCs treated for 24 h with LPS, poly(I:C), or SEA. Plots show analysis of CD107a and CD56 gated on live singlet NK cells; representative from one donor of six tested. (B) Total percentage of CD107a-positive NK cells after 5-h culture alone (NK only) with immature DCs or DCs treated with LPS, poly(I:C), or SEA; points of the same shape/color show measurements from the same donor. Bars show mean (±SD) of data pooled from six donors. (C) Annexin V staining of DCs cultured alone (top) or with autologous NK cells at a 1:1 ratio (bottom) for 5 h. Histograms from one representative donor showing the proportion of annexin V–negative (left) and –positive populations (right) of DCs. (D) Difference in annexin V staining of DCs cultured alone (circles) compared with DCs cultured with autologous NK cells at a 1:1 ratio for 5 h (squares). Connected data points show paired measurements from six independent donors. (E) Specific lysis of 221 target cells, immature DCs, or DCs treated for 24 h with LPS or SEA by autologous NK cells at 1:1, 5:1, and 10:1 NK:DC (E:T) ratios measured by release of 35S over 5 h. Plots show data from one representative donor of three; mean of values measured in triplicate. (F) Percent of DCs expressing CD86 after treatment for 24 h with LPS, poly(I:C), or SEA in the presence of 50 ng/ml TNF-α and 20 ng/ml IL-1β as maturation factors. (G) The proportion of NK cells stained positive for CD107a after 5-h culture with immature DCs or DCs that had previously been treated for 24 h with LPS, poly(I:C), or SEA in the presence of maturation factors TNF-α and IL-1β. (H) The difference in annexin V staining of immature DCs or DCs treated with LPS, poly(I:C), or SEA in the presence of maturation factors TNF-α and IL-1β cultured alone (circles) compared with DCs cultured with autologous NK cells at a 1:1 ratio for 5 h (squares). Connected data points show paired measurements from five independent donors. (I) IL-4 and IFN-γ production by CD4+ T cells stimulated with PMA and ionomycin after 13-d culture with immature DCs, LPS, or omega-1–treated DCs in the presence of staphylococcal enterotoxin B; ratio of IL-4–positive over IFN-γ–positive CD4+ T cells. (J) Total percentage of CD107a-positive NK cells after 5-h culture alone (NK only) with immature DCs or DCs previously treated with LPS or omega-1; points of the same shape/color show measurements from the same donor. Bars show mean (±SD) of data pooled from five donors. In all plots, circles represent data points from individual donors, and bars show mean (±SD) of three to six independent donors. *p < 0.05, **p < 0.01, ***p < 0.001, ****p < 0.0001, analyzed by repeated measures one-way ANOVA with Tukey multiple comparisons (B, G, and J), one-way ANOVA with Dunnett multiple comparisons (F), and repeated measures two-way ANOVA with Sidak multiple comparisons (D and H).

