FIGURE 5.
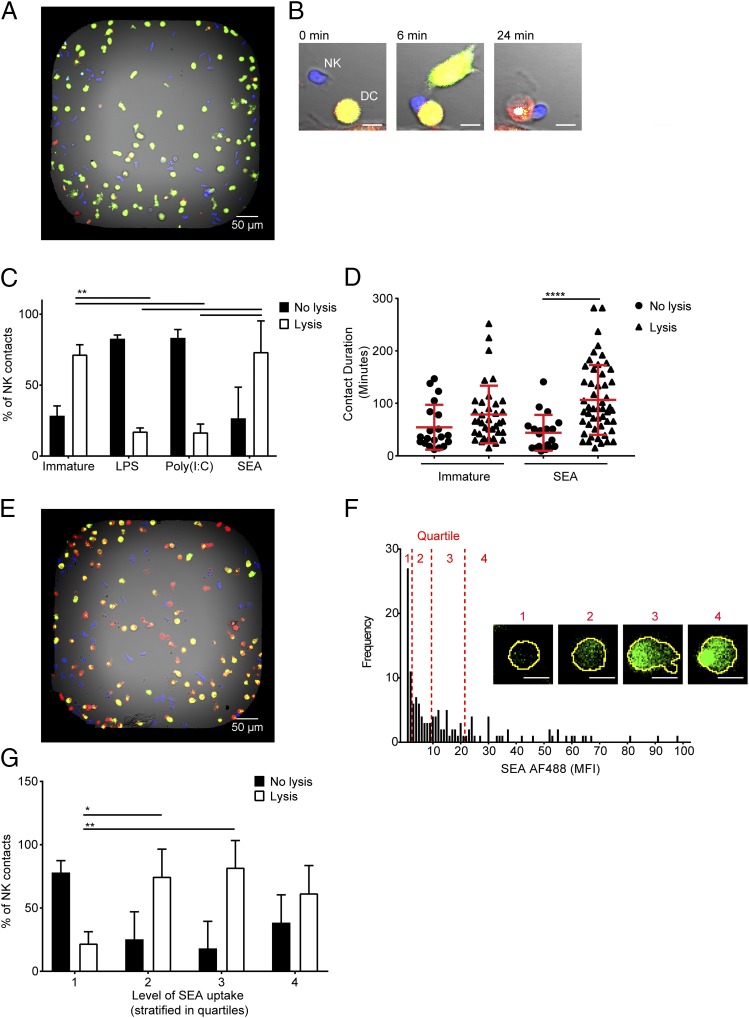
DCs that take up SEA are preferentially lysed by NK cells. (A) Representative image of dye-labeled DCs (green) and NK cells (blue) coincubated in a bespoke microwell chip; scale bar, 50 μm. (B) An example time-lapse sequence showing an NK cell (blue) forming a contact with a DC (green). Upon lysis, the DC turns from green/yellow to red (24 min); scale bar, 10 μm. (C) Proportion of NK cell contacts with immature DCs or DCs treated for 24 h with LPS, poly(I:C), or SEA resulting in DC survival (no lysis, filled bars) or death (lysis, empty bars). (D) Duration of contacts formed between NK cells and immature DCs and DCs treated for 24 h with SEA resulting in either DC survival (no lysis, circles) or DC death (lysis, triangles). (E) Dye-labeled DCs (red) and NK cells (blue) cocultured in a microwell after DCs were pretreated for 24 h with AF488-labeled SEA (green). (F) Distribution of MFI of SEA AF488 inside DCs from one representative well of nine imaged over three independent experiments. Quartiles in the level of SEA staining are marked in red with representative images of DCs labeled with AF488 SEA (green) from the first (1), second (2), third (3), or fourth (4) quartiles; scale bar, 10 μm. (G) Proportion of NK cell contacts resulting in survival (no lysis, filled bars) or death (lysis, empty bars) of DCs in the first (1), second (2), third (3), or fourth (4) quartiles in amount of AF488-labeled SEA they have taken up. In (C) and (G), bars show mean (±SD) from three independent donors with at least 40 cells per condition per donor, analyzed by two-way ANOVA with Tukey multiple comparisons. In (D), shapes represent individual NK cell–DC contacts with lines showing mean (±SD) of data pooled from three independent donors, analyzed by Kruskal–Wallis test with Dunn multiple comparisons. *p < 0.05, **p < 0.01, ****p < 0.0001.

