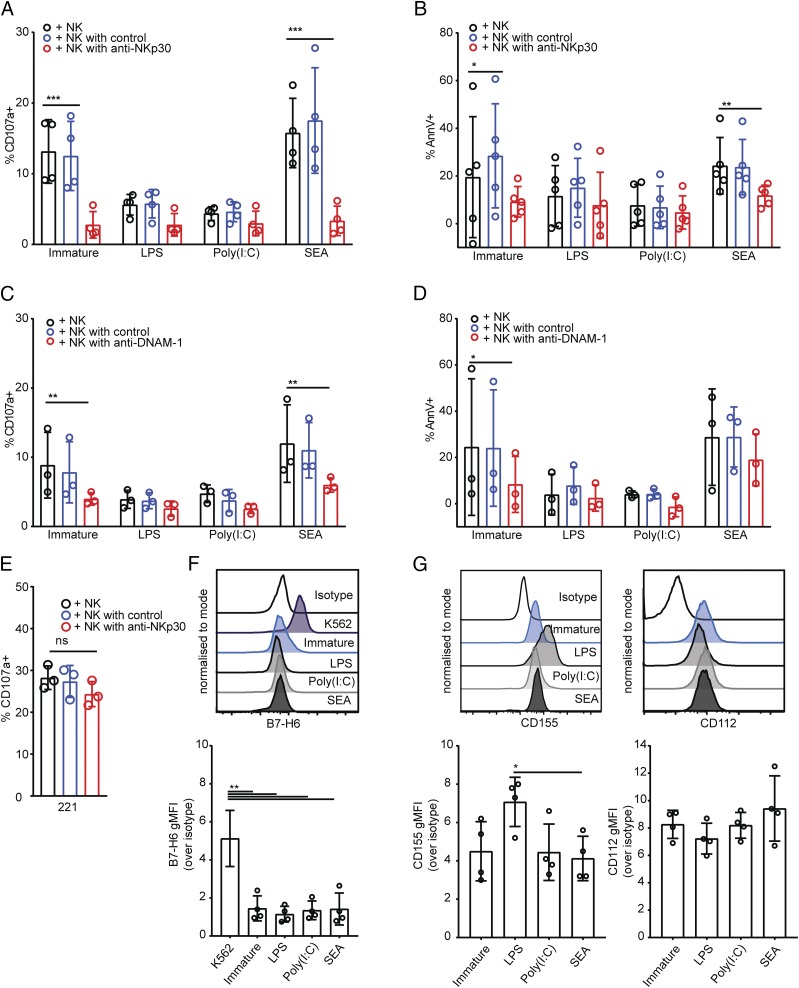
FIGURE 6.
DNAM-1 and NKp30 contribute to lysis of DCs treated with SEA. (A and B) Percent of NK cells stained positive for CD107a (A) or stained with annexin V (B), after 5-h coculture with immature DCs or DCs treated for 24 h with LPS, poly(I:C), or SEA, where NK cells were preincubated for 1 h in culture medium alone (black bars), with an isotype-matched control Ab (blue bars), or NKp30 blocking Ab (red bars). Percent of annexin V–positive DCs cultured alone subtracted as background. (C and D) Percent of NK cells stained positive for CD107a (C) or stained with annexin V (D) after 5-h coculture with immature DCs or DCs treated for 24 h with LPS, poly(I:C), or SEA, where NK cells were preincubated for 1 h in culture medium alone (black bars) with an isotype-matched control Ab (blue bars) or DNAM-1 blocking Ab (red bars). Percentage of annexin V–positive DCs cultured alone subtracted as background. (E) Percentage of NK cells stained positive for CD107a after 5-h coculture with 721.221 target cells, NK cells preincubated for 1 h in culture medium alone (black bars) with an isotype-matched control Ab (blue bars) or NKp30 blocking Ab (red bars). (F) Expression of B7-H6 on the surface of immature DCs or DCs treated for 24 h with LPS, poly(I:C), or SEA. Histograms show representative overlays of live, CD11c+ CD14− singlet DCs from representative donor (left) showing, from top to bottom, isotype-matched control staining, then mAb staining of K562 cells, immature DCs, or DCs treated with LPS, poly(I:C), or SEA. Graphs shows gMFI over isotype-matched control staining of DCs from four independent donors. (G) Expression of CD112 and CD155 on the surface of immature DCs or DCs treated for 24 h with LPS, poly(I:C), or SEA. Histograms show representative overlays of live CD11c+ CD14− singlet DCs from representative donors (top) showing, from top to bottom, isotype-matched control staining, then mAb staining of immature DCs or DCs treated with LPS, poly(I:C), or SEA (as indicated). Graphs shows gMFI over isotype-matched control staining of DCs from four independent donors. Data points represent individual donors, bars show mean ± SD. (A–D) Analyzed by repeated measures two-way ANOVA with Dunnett multiple comparisons. (E) Analyzed by Kruskal–Wallis test with Dunn multiple comparisons. (F and G) Analyzed by repeated measures one way ANOVA with Tukey multiple comparisons. *p < 0.05, **p < 0.01, ***p < 0.001.

