Figure 1.
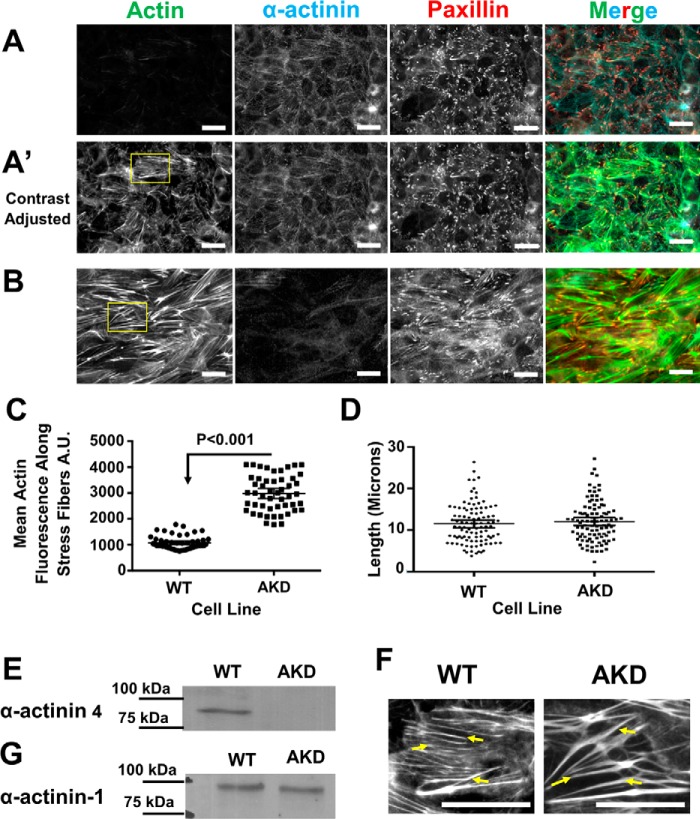
α-Actinin-4 depletion in MDCK cells leads to an increase in stress fiber mass. A, basal surface of WT MDCK cells stained for α-actinin-4, paxillin, and actin showing stress fibers. Micrographs have been adjusted the same as in B for comparison. A′, micrographs are same as above, but the contrast was adjusted to better show the stress fibers. Scale bars are 20 μm. B, basal surface of α-actinin-4–depleted cells stained for α-actinin-4, paxillin, and actin. C, graph of the mean average intensity ±95% confidence interval of actin along filaments. The mean intensity is significantly greater in α-actinin-4–depleted cells. D, graph of the mean fiber length ±95% confidence interval in WT and AKD cells. The mean length is not significantly different in depleted cells. E, Western blotting, with molecular mass markers, of WT and α-actinin-4–depleted cell lines demonstrating α-actinin-4 is depleted. F, region of interest from A′ and B showing examples of actin stress fibers that were counted in WT cells and actinin–depleted cells. Stress fibers are marked with arrows. Scale bars are 20 μm. G, Western blotting, with molecular mass markers, of WT and α-actinin-4–depleted cell lines demonstrating α-actinin-1 is unchanged in actinin-4–depleted cells.

