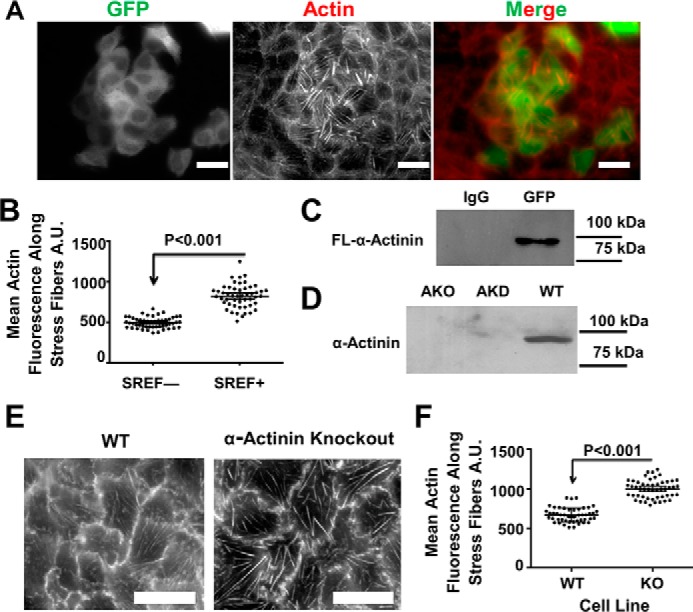
Figure 2.

Disrupting α-actinin function via a dominant-negative or knockout approach also increases stress fiber mass. A, basal surface of MDCK cells overexpressing an actinin mutant lacking the actin-binding domain with a GFP tag and stained with phalloidin showing stress fibers. Scale bars are 20 μm. B, graph of the mean average intensity ± 95% confidence interval of actin along stress fibers. A.U., arbitrary units. C, Western blotting probing endogenous actinin from an immunoprecipitation of GFP from the overexpressing cells in A. D, Western blotting of WT, actinin knockdown, and knockout cell lines demonstrating that the knockout cell line lacks actinin-4 expression. E, micrographs of WT and knockout cell lines stained with phalloidin showing the stress fibers. F, graph of the mean average intensity ±95% confidence interval of actin along stress fibers from WT and KO cell lines. The mean intensity is significantly greater in the knockout cell line just as the knockdowns from Fig. 1.
