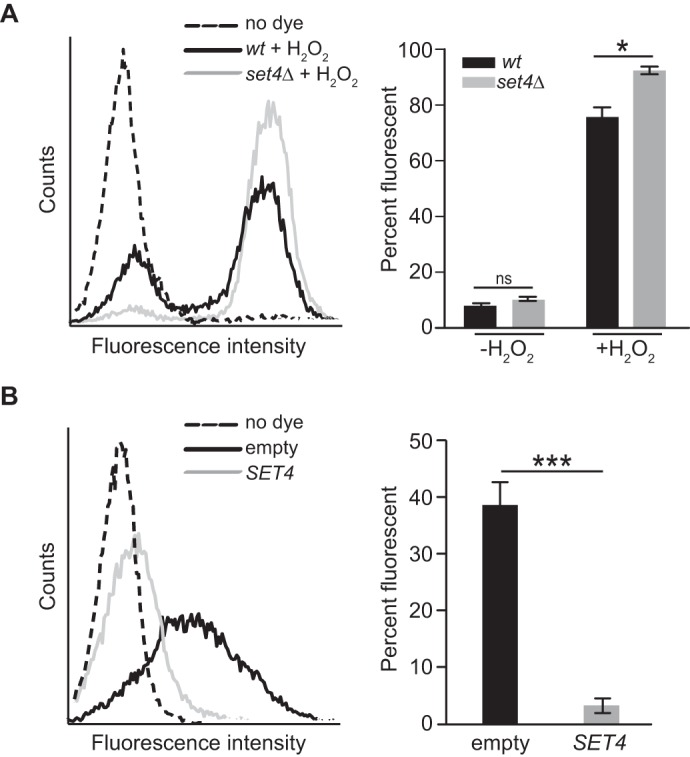
Figure 3.

Intracellular ROS levels are altered in set4Δ and SET4-overexpressing cells. Shown are representative flow cytometric histograms of intracellular ROS levels detected using DCFH-DA (left) and percentage fluorescent cells for each strain (right). A, WT (yEG001) and set4Δ (yEG325) strains were grown to mid-log phase in YPD or YPD with 4 mm H2O2 for 30 min. B, yeast carrying either pMN3 (empty) or pMN3-SET4 (yEG372 and yEG375) were grown to early-log phase in SC-URA and treated with 25 μm β-estradiol for 3 h. Error bars, S.E. from three biological replicates. Asterisks, p values from unpaired t tests (*, p ≤ 0.05; ***, p ≤ 0.001).
