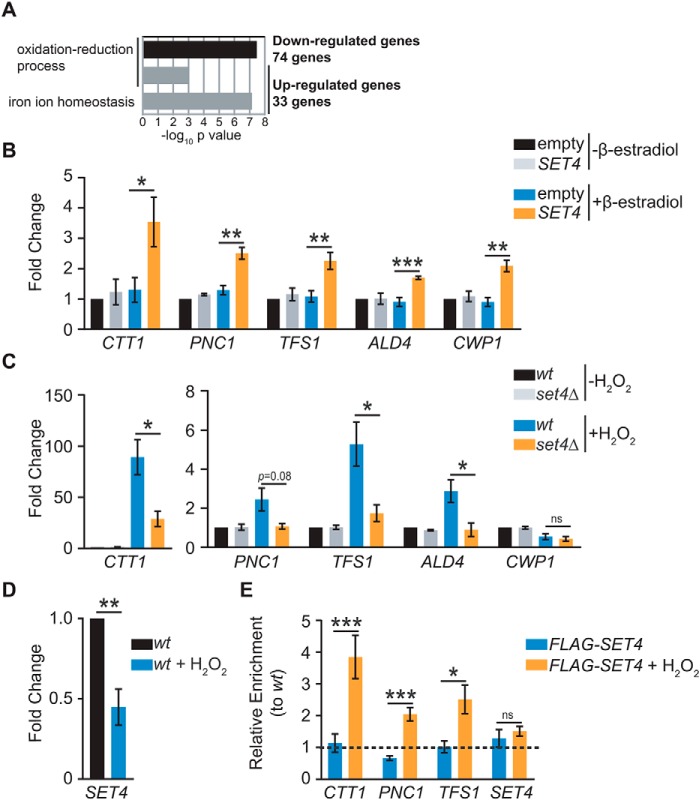
Figure 5.
Set4 promotes activation of stress response genes. A, GO analysis of significantly differentially expressed genes identified by microarray analysis of set4Δ cells from Kemmeren et al. (35). The −log10 p value of the enriched GO biological process categories are shown for both down-regulated and up-regulated genes. B, RT-qPCR of stress response genes identified by Kemmeren et al. (35) from yeast with empty pMN3 or pMN3-SET4 in the presence or absence of β-estradiol. Expression levels were normalized to SCR1. -Fold change relative to empty vector strain without β-estradiol treatment is shown. Error bars, S.E. from at least three biological replicates. C, RT-qPCR of stress response genes from WT (yEG001) and set4Δ (yEG322) strains grown in YPD and treated with 0.4 mm H2O2 for 30 min. Expression levels were normalized to SCR1. -Fold change relative to the WT strain without H2O2 treatment is shown. Error bars, S.E. from at least three biological replicates. PNC1 consistently showed lower expression in set4Δ cells treated with H2O2, although this did not reach the threshold for statistical significance due to variability in its expression levels in H2O2. D, -fold change, as in C, of SET4 mRNA in WT cells without or with 0.4 mm H2O2 for 30 min. E, chIP of FLAG-Set4 (expressed from its endogenous promoter; yEG513) from cells grown to mid-log phase in YPD or YPD with 0.4 mm H2O2 for 30 min. Percentage of input was calculated for each IP and primer set, and enrichment is shown for FLAG-Set4 relative to the WT (untagged) strain either with or without H2O2 treatment. The primers detect the promoter sequences for each of the indicated genes. Error bars, S.E. from three biological replicates. For all panels, asterisks represent p values from unpaired t tests (*, p ≤ 0.05; **, p ≤ 0.01; ***, p ≤ 0.001; ns, not significant), except for E, in which a paired t test was used.

