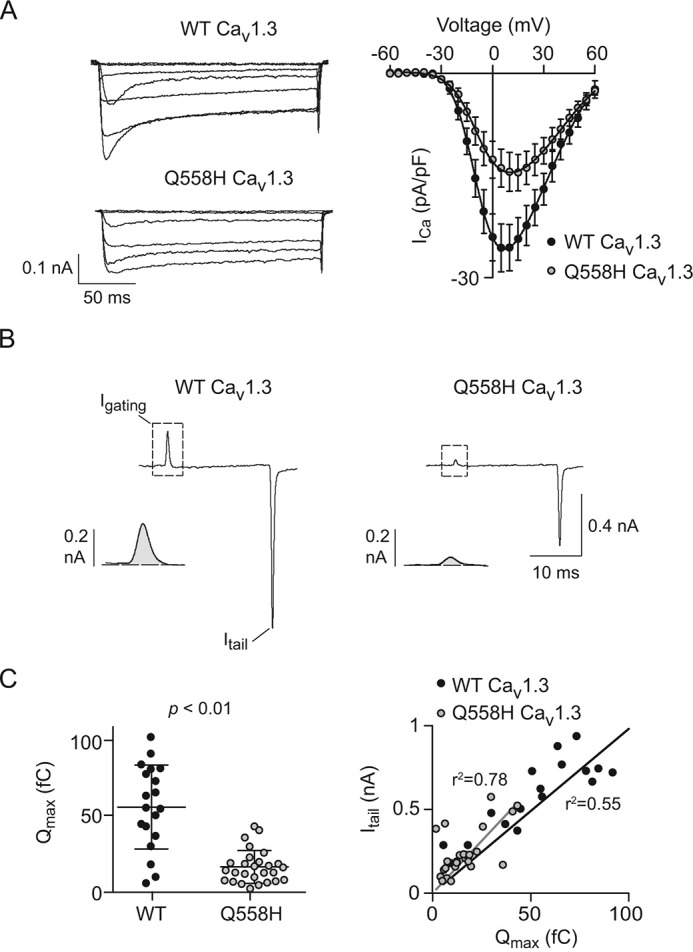
Figure 2.

Q558H reduces current density and the number of functional Cav1. 3 channels. A, left, family of representative current traces obtained using 200-ms test pulses to various voltages from a holding voltage of −80 mV. Right, current-voltage (I-V) plots. n values and I-V parameters are listed in Table 1. Results are from four independent experiments. B, representative traces showing Igating evoked by a 20-ms step depolarization from −80 mV to +70 mV and Itail upon repolarization to −80 mV. Insets show Igating and Itail on expanded time scale. C, left, average maximal gating charge (Qmax) for WT and mutant; p value was determined by t test. Right, Itail for each cell is plotted against Qmax. The fit by linear regression and coefficient of determination (r2) are shown for WT (n = 19 cells) and Q558H (n = 27 cells). Results are from four independent experiments. Error bars represent S.E.
