Figure 7.

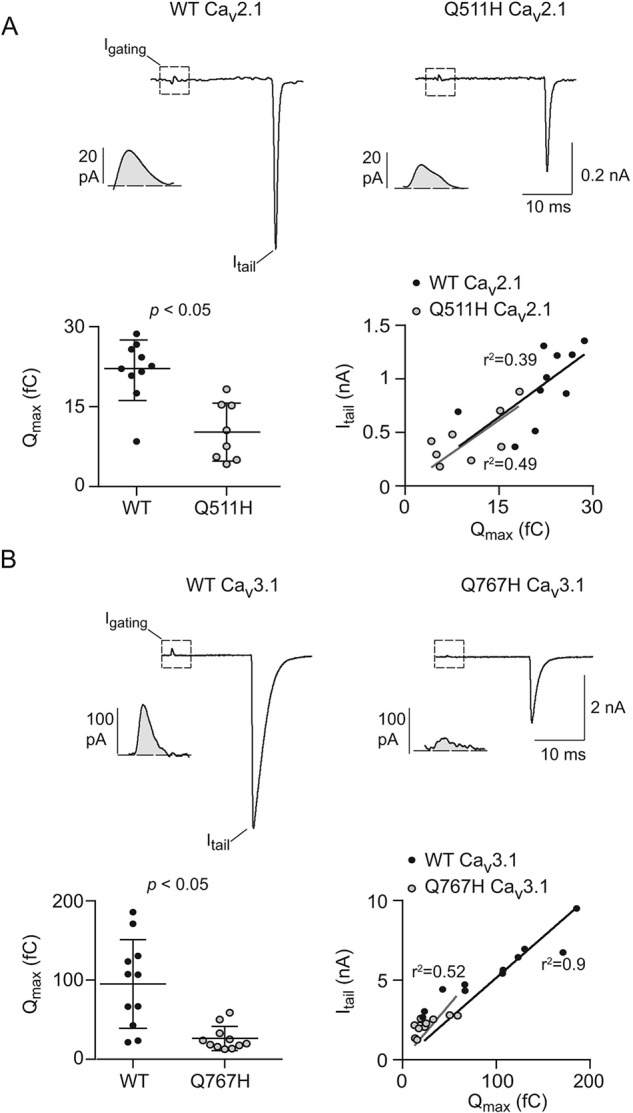
Q511H in Cav2.1 and Q767H in CaV3.1 decrease the number of functional channels. A, top, representative current traces from WT (left) or Q511H mutant (right) Cav2.1 channels showing Igating evoked by a 20-ms step depolarization from −80 mV to +70 mV and Itail upon repolarization to −80 mV. Insets show Igating on expanded time scale. Bottom left, average maximal gating charge (Qmax) for WT (n = 10 cells) and Q511H mutant Cav2.1 channels (n = 8 cells); p value was determined by t test. Bottom right, Itail for each cell is plotted against Qmax. The fit by linear regression and coefficient of determination (r2) are shown for WT and mutant channels. Results are from four independent experiments. Error bars represent S.E. B, same as in A except for WT (n = 11 cells) and Q767H mutant CaV3.1 channels (n = 11 cells). Results are from four independent experiments.
