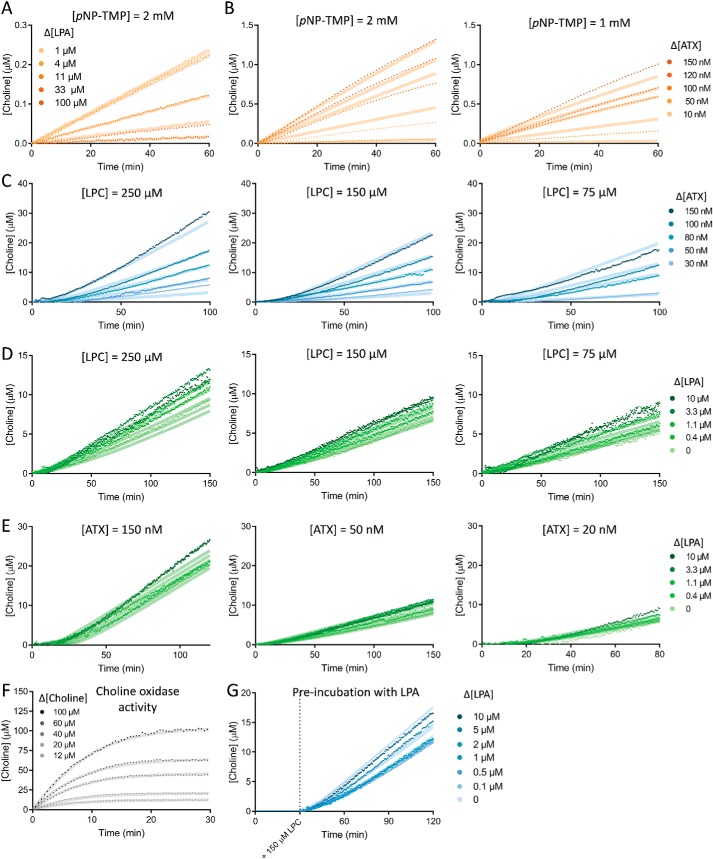
Figure 7.
Key kinetic assay experimental data as fitted on KinTek ExplorerTM. A, implementation of the role of LPA as an inhibitor in pNP-TMP hydrolysis by ATX; this allowed determination of KD-LPAo. B, determination of the rate constants of ATX on pNP-TMP hydrolysis by titrations of ATX in two concentrations of pNP-TMP. C, estimation of KD-LPC and kcat (both fast and slow) by titration of ATX versus different concentrations of 18:1 LPC. D and E, determination of the specific rate constants defining LPA-mediated ATX activation performed by titrating 18:1 LPA versus different concentrations of LPC (D) and ATX (E). F, fit to choline oxidase activity upon the addition of choline chloride (Fig. 2C). G, fit to the experiment presented in Fig. 4F; pre-incubation with different concentrations of 18:1 LPA showed a decrease in the lag phase of ATX catalysis upon the addition of 150 μm LPC. In all cases, the transparent background line on each curve depicts the fit of the model to the experimental data, which are represented as points. When not indicated, ATX concentration is 20 nm, and LPC concentration is 150 μm.

