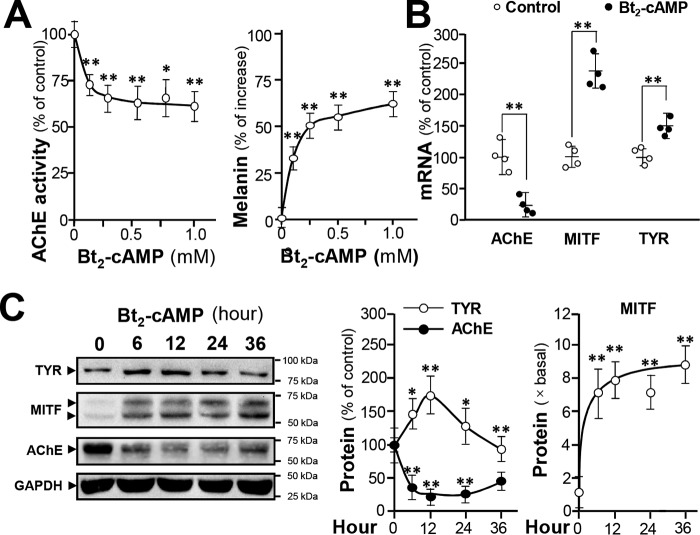
Figure 3.
cAMP suppresses AChE expression in B16F10 cells. Cultured B16F10 cells were treated with Bt2-cAMP at various concentrations, and cell lysates were collected. A, AChE activity is expressed as the percentage of control (sample treated with vehicle); intracellular melanin content is expressed as the percentage of increase to control. B, cultured cells were treated with Bt2-cAMP (0.5 mm) for 24 h, and total RNA was extracted for qPCR of ACHE, MITF, and TYR genes. Data are normalized and expressed as the percentage of control. C, cultured cells were treated with Bt2-cAMP (0.5 mm) for different time courses, and the cell lysates (40 μg) were collected for Western blot analysis. GAPDH was used as a loading control. AChE (∼60 kDa), TYR (∼80 kDa), MITF (∼60 kDa), and GAPDH (∼37 kDa) are shown. Data are normalized and expressed as the percentage/fold of control. All values are in mean ± S.D., n = 4, each with triplicate samples; *, p < 0.05; **, p < 0.01.

