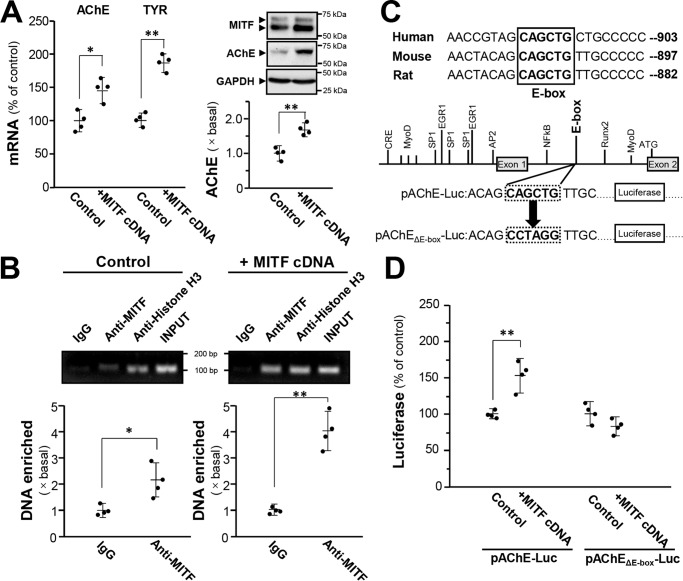
Figure 5.
MITF induces AChE expression through binding to E-box. A, cultured B16F10 cells were transfected with cDNA encoding MITF, and cell lysates were collected for quantitative PCR (left panel) and Western blot analysis (right panel). GAPDH was used as loading control. Data are normalized and expressed as the percentage/fold of control (transfected with empty vector). B, cultured B16F10 cells were transfected with cDNA encoding MITF, then the quantitative ChIP assay was performed. The primers flanking the E-box–binding site of the ACHE promoter were used, and the results were analyzed through the fold enrichment method. The signal intensities were expressed as the fold of basal. C, mutagenesis of the E-box–binding site on the ACHE promoter in pAChE-Luc is shown. D, cultured B16F10 cells were transfected with pAChE-Luc or pAChEΔE-box-Luc, and the cell lysates were collected for luciferase assay. Data are normalized and expressed as the percentage of control (transfected with empty vector). All values are in mean ± S.D., n = 4, each with triplicate samples; *, p < 0.05; **, p < 0.01.

