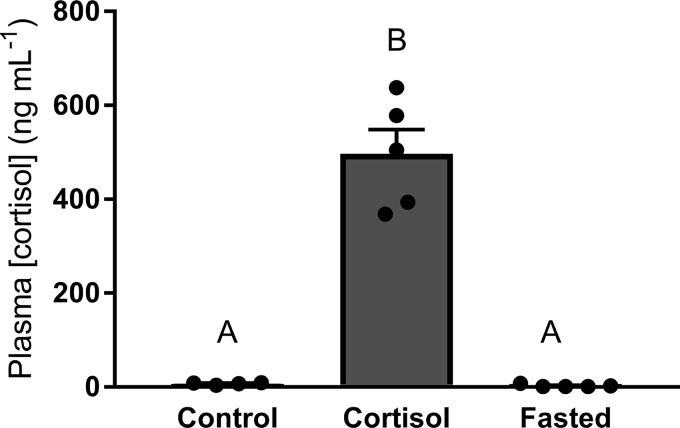
Fig. 2.
Plasma cortisol concentrations of control, cortisol-treated, and fasted rainbow trout (Oncorhynchus mykiss). Values are presented as means ± SE with n = 5–7 for all groups; values for individuals included in the means are indicated by the symbols. Bars that share a letter are not significantly different from one another (see text for details).

