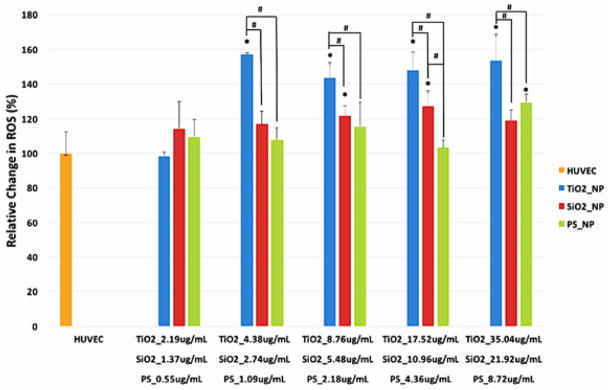
Figure 3.
ROS level in HUVEC exposed to TiO2, SiO2, and PS NPs. HUVEC were exposed in quadruplicate to various concentrations of TiO2, SiO2, and PS NPs for 24 hours. ROS level was then measured using H2DCFDA. (Error bars represent mean ± standard deviation (SD) of the sample. Data were analyzed by ANOVA with Tukey’s post test, * represents significant difference from untreated HUVEC, # denotes significant difference within the group, n=4, p < 0.05.)

