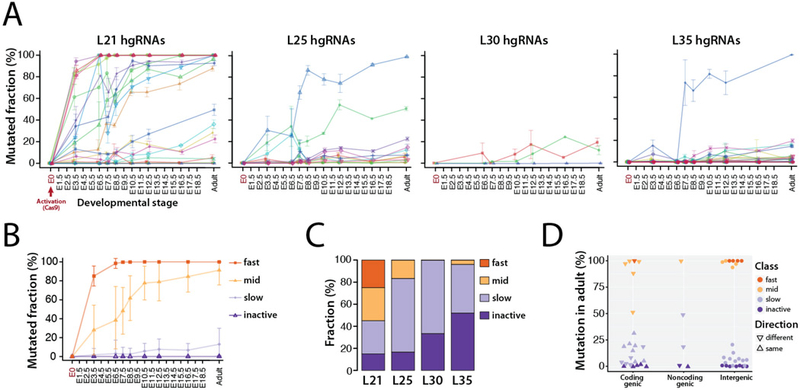
Fig. 2. Activity of MARC1 hgRNAs.

(A) Activity profiles of all 60 hgRNAs in embryonic and adult progenies of MARC1 founder crossed with Cas9-knockin females, broken down by hgRNA length. The fraction of mutant (non-parental) spacer sequences in each hgRNA is measured. Lines connect the observed average mutation rates of one hgRNA. Mean ±SEM is shown (N is different for each value, see Table 2). See Table S2 for numerical values of the plot. (B) Average activity profiles of each hgRNA class in embryonic and adult progenies of MARC1 founder crossed with Cas9-knockin females. Mean ±SEM is shown as a representation of range of activity (N is different for each value, see Table 2). (C) Functional categorization of hgRNAs based on their activity profile in panel A, broken down by length. (D) Position and transcription direction of hgRNAs with respect to all known coding and non-coding genes, annotated for their functional category. See Table S3 for the genes hgRNAs are located in and fig. S3 for breakdown of this plot by hgRNA length.
