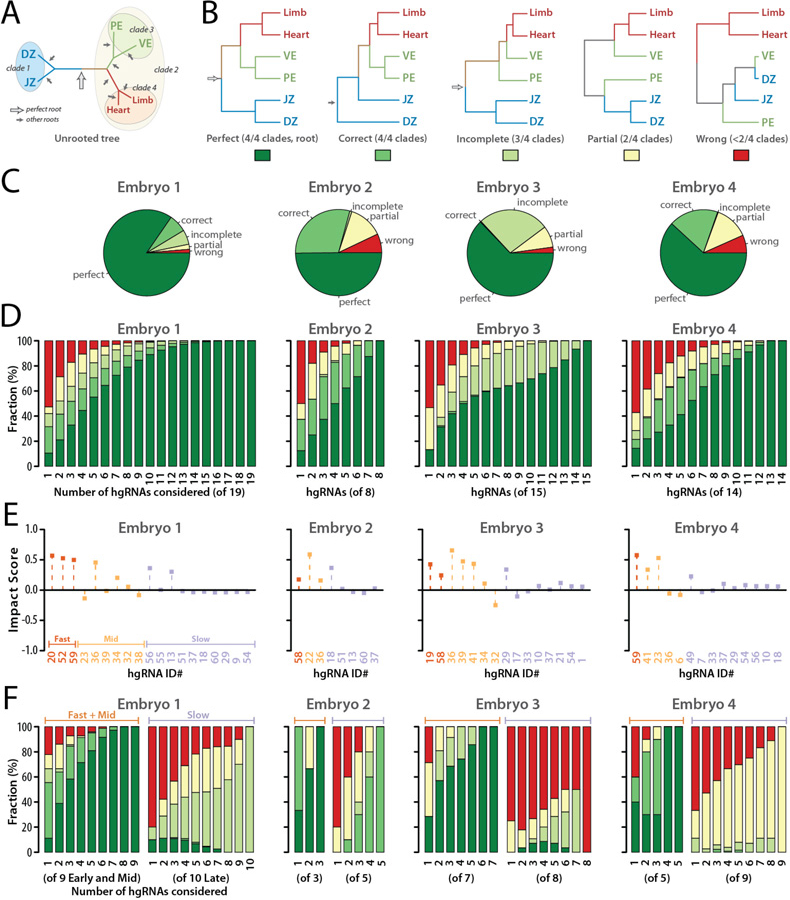
Fig. 6. Lineage tree derivation robustness and contribution of each hgRNA.

(A) The correct unrooted tree topology for the earliest lineages in mouse. Arrows indicate all possible roots. The empty arrow indicates the perfect root. (B) The perfect rooted topology and an example from each of the other topology classifications. The colored boxes below each topology comprise the color key for the following panels of the Fig.. (C) For each of the four embryos analyzed, distribution of tree calculation outcomes from all possible subsets of hgRNAs ( non-null subsets for an embryo with n hgRNAs). (D) Distribution of tree calculation outcomes when including only m of the n hgRNAs in each embryo ( combinations,). Color code is as described in panel B. See also fig. S9 and fig. S10 for all combinations included and excluding each hgRNA. (E) Impact Score of each hgRNA in the early lineage tree of each embryo. (F) Distribution of tree calculation outcomes when only including k of the fast and mid hgRNAs (left side of each panel, combinations) or k of the slow hgRNAs (right side of each panel, combinations). Color code is as described in panel B.
