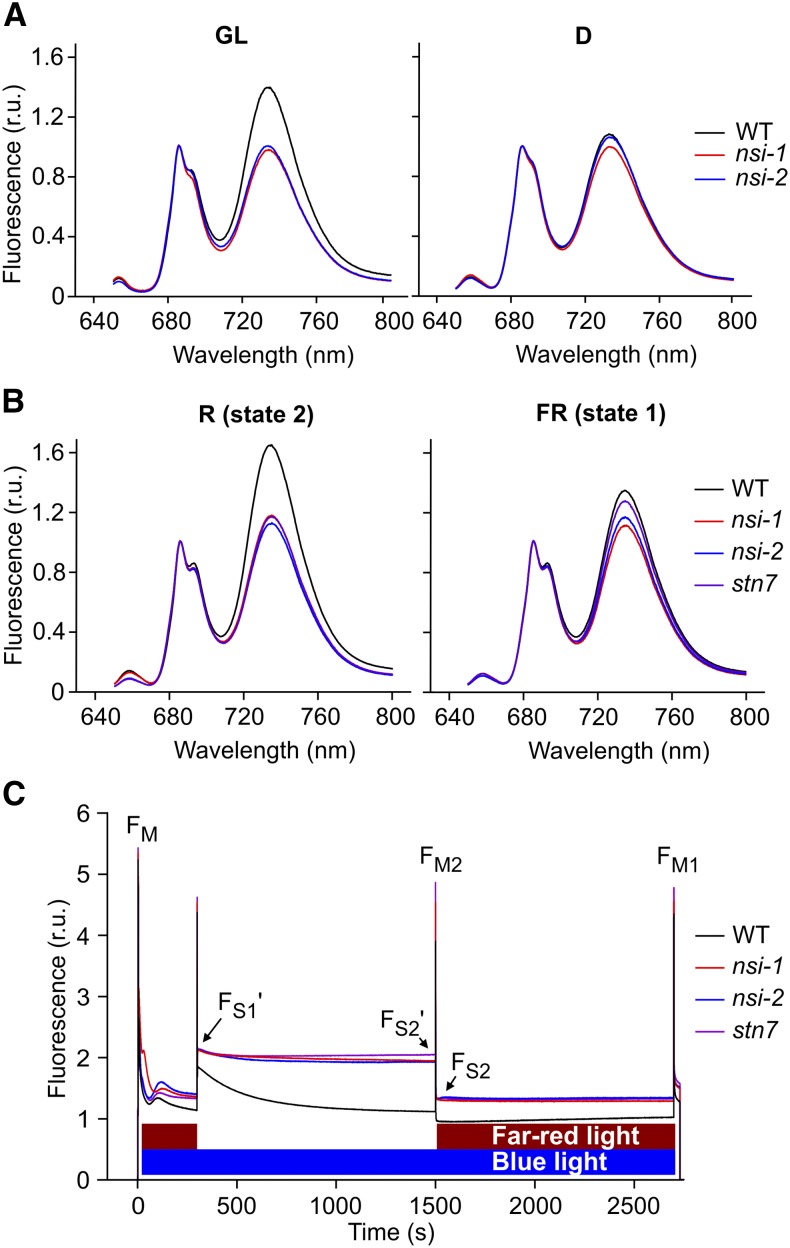
Figure 4.
State Transitions in Wild Type, nsi, and stn7 under Different Light Treatments.
(A) 77K fluorescence emission spectra from thylakoids isolated from GL- and D-adapted plants.
(B) 77K fluorescence emission spectra from thylakoids isolated from R (660 nm) or FR light (735 nm) treated plants. Spectra in (A) and (B) were normalized to 685 nm and present an average of three biological replicates. Fluorescence emission around 685 to 695 nm originates from PSII and fluorescence emission around 735 nm from PSI.
(C) Representative graphs of state transition measurements with a pulse amplitude modulation fluorometer.

