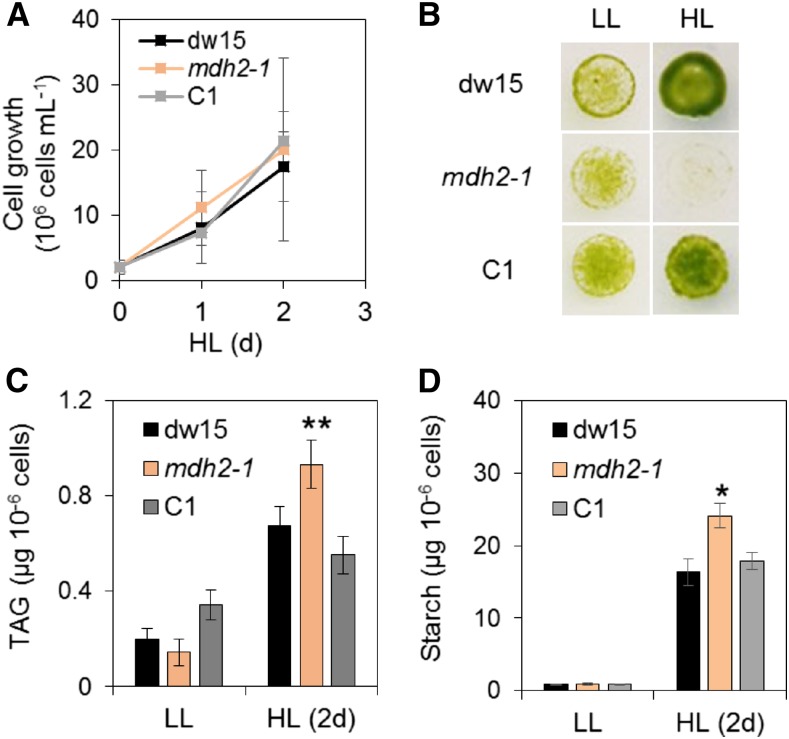
Figure 11.
HL Response of the mdh2-1 Mutant during Photoautotrophic Growth.
(A) Growth kinetics in liquid cultures under HL.
(B) Growth comparison on agar plates.
(C) TAG content on a per cell basis.
(D) Starch content on a per cell basis.
Cells were cultivated under constant light (either HL or LL) in photoautotrophic conditions with additional supply of 2% CO2 in the air. Light was provided by a cool LED white light. The same number of cells were inoculated on MM agar plate and kept under continuous light to monitor cell growth. Images were taken 6 d after cells being deposited. Values are the mean of biological replicates (i.e., independent shaking flask cultures; n = 4, sd). Asterisks indicate significant difference from control strains by paired-sample Student’s t test (*P ≤ 0.05 and **P ≤ 0.01). LL, 50 µmol m−2 s−1; HL, 500 µmol m−2 s−1.

