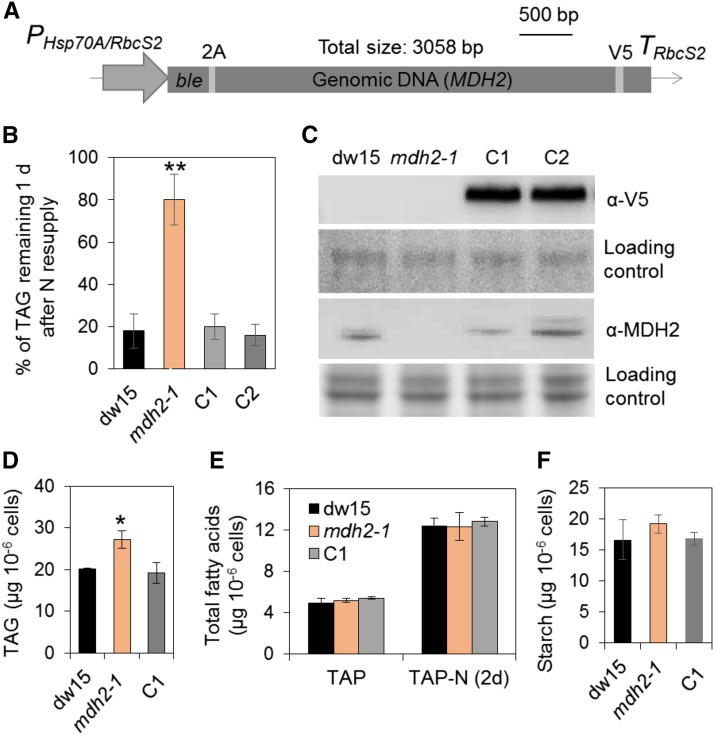
Figure 2.
Genetic Complementation of mdh2-1 Mutant.
(A) The construct used for genetic transformation.
(B) Restoration of TAG levels to that of the wild type in the complemented lines.
(C) Immunoblot detection of MDH2 in complemented lines using anti-V5 and anti-MDH2 antibodies.
(D) TAG analysis during mixotrophic N deprivation.
(E) Total FA quantification.
(F) Starch analysis during mixotrophic N deprivation.
TAG and starch contents were determined in N-deprived cells (2–3 d) and in N-resupplied cells (1 d). Two independent transformants (C1 and C2) were analyzed, and each line with three biological replicates (i.e., independent shaking flask cultures) and two technical replicates (i.e., different sampling from the same flask). Values are the mean of biological replicates (n = 3, sd). Asterisks indicate statistically significant changes compared with the control strains (dw15 and C1) by paired-sample Student’s t test (*P ≤ 0.05 and **P ≤ 0.01). Cells were grown in mixotrophic conditions under constant light. PHsp70A/RbcS2, the heat shock protein 70A and Rubisco small subunit promoter; ble, antibiotic resistance marker gene; TRbcS2, RbcS2 terminator; 2A, FMDV 2A self-cleaving peptide. For immunoblots, samples were loaded at equal total protein amounts. Loading controls were stained by Ponceau red for the upper panel and Coomassie blue for the lower panel.

