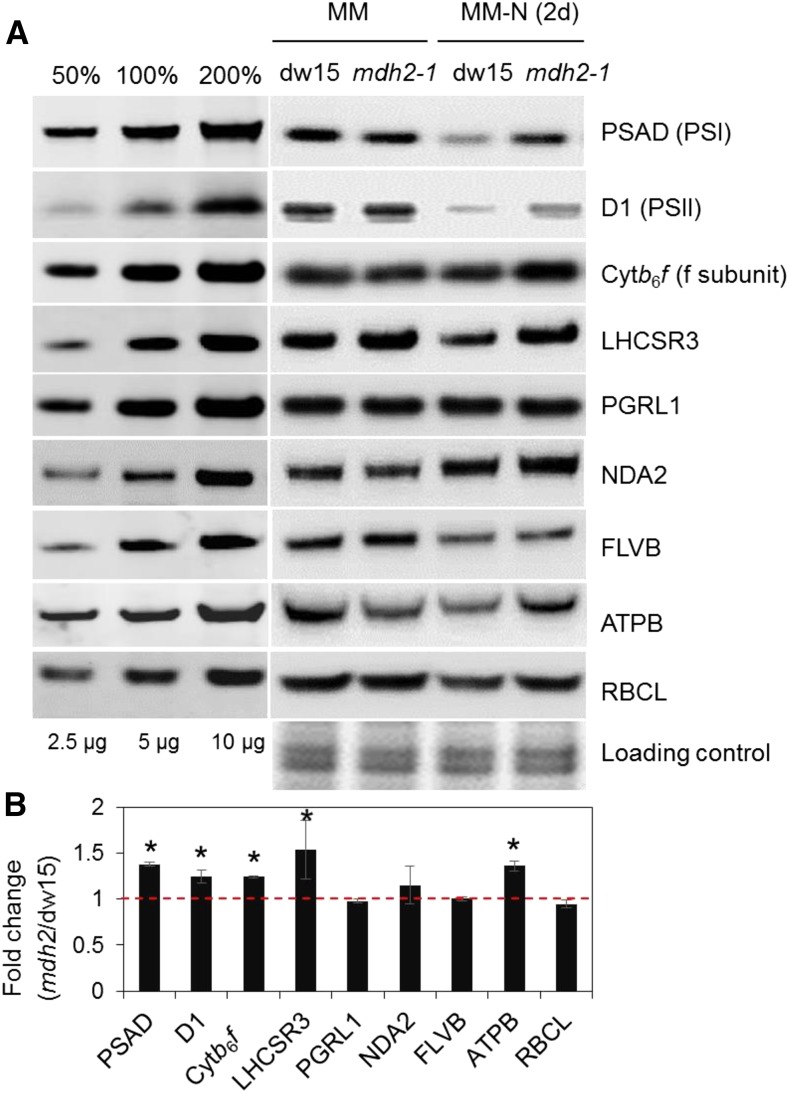
Figure 8.
Immunoblot Analyses of Photosystem Proteins during Photoautotrophic N Deprivation.
(A) Representative images of immunoblot analysis.
(B) Quantification of signal intensities from cells being N-starved for 2 d.
Proteins were collected from cells before (MM) and after photoautotrophic (+2% CO2 supplemented in the air) N deprivation (MM-N, 2d) under constant light. Representative images of immunoblot analysis are shown. Signals for (B) were averaged from three biological replicates (i.e., independent shaking flask cultures) for N-starved cells (n = 3; sd). Asterisks indicate significant difference from the parental strain dw15 by paired-sample Student’s t test (*P ≤ 0.05). Samples were loaded at equal total protein amounts and stained using Coomassie blue.

