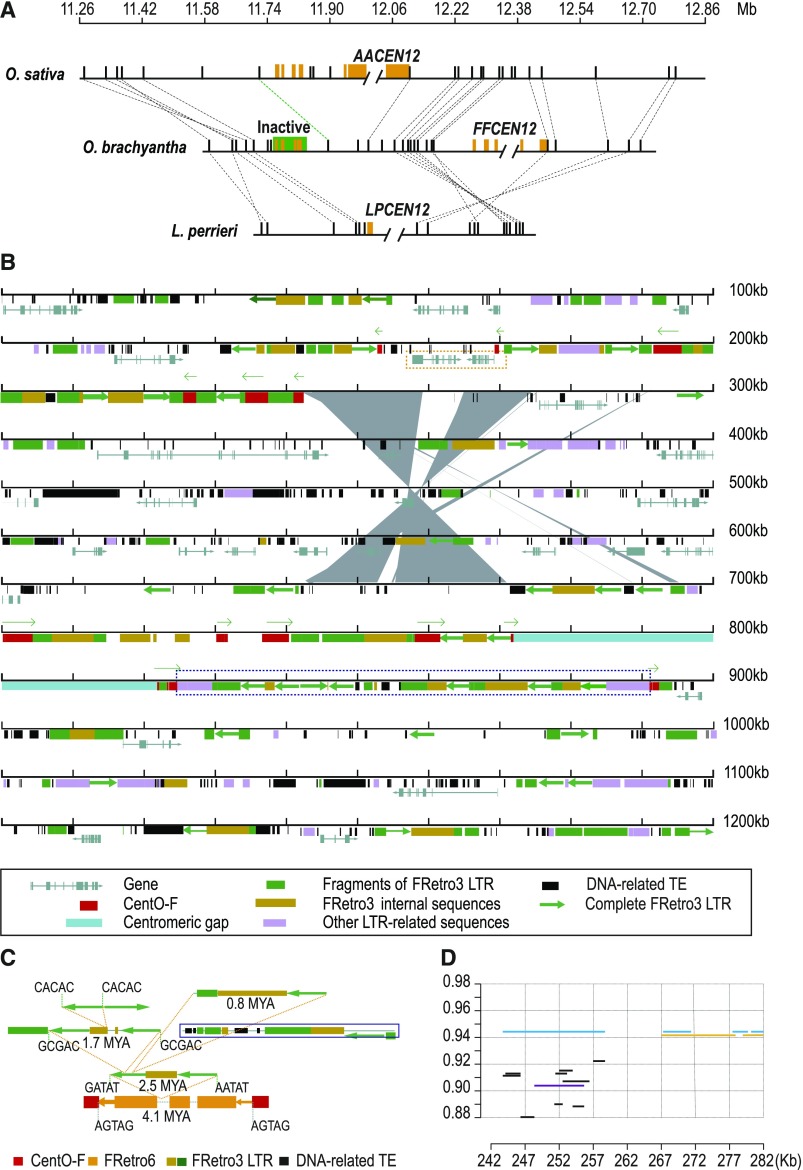
Figure 4.
Evolutionarily New Centromere on O. brachyantha Chromosome 12 Probably Resulted from a Duplicated Transposition.
(A) Gene synteny map revealed centromere on O. brachyantha chromosome 12 has repositioned. Double slashes indicate the positions of centromeric gaps, representing the potential centromere positions in each species. Orange rectangles depict centromeric satellite repeats. Orthologous genes (black rectangles) are connected by dashed lines. The predicted ancestral centromere retains a small cluster of residual centromeric satellite repeats (shaded in green). The dashed line in green indicates an inversion containing only one gene has occurred between O. sativa and O. brachyantha.
(B) Annotation map of the 1.2-Mb region of O. brachyantha Cen12. Gene models, transposable elements (see detailed figure legend in the black box below), CentO-F clusters (red squares, with directions indicated by green arrows above), and a segmental duplication event (gray polygon) are depicted in the map. The size of duplicated segment is approximate 28 kb. The paralogous segments are exactly adjacent to the CentO-F sequence in the ancestral centromere position. Two genes in the dashed orange box were inserted into the ancestral centromeric position in O. brachyantha.
(C) Reconstructing the nested insertion history of LTR-retrotransposons at the region within CentO-F cluster at the distal edge of centromeric gap (highlighted with dashed blue box in Figure 4B). A FRetro6 element inserted into the CentO-F cluster occurred at 4.1 Mya. Three FRetro3 insertion events occurred after then, ranging in age from 2.5 to 0.8 Mya. Sequences that can’t be inferred are shown in dashed black box, but their insertion times should be younger than 2.5 Mya.
(D) Pattern of pericentromeric segmental duplications at O. brachyantha Cen12 region. The horizontal axis indicates the selected segment from the O. brachyantha Cen12 region (see coordinate in Figure 4B). This segment traces genomic regions from three chromosomes (black lines, Chr4; purple lines, Chr9; orange lines, Chr1; also see Supplemental Table 8). The light-blue lines indicate the local paralogous segment within the Cen12 region. The vertical axis indicates sequence identity. Sequence identity of these two paralogous segments is of the highest value, ∼0.945.

