Figure 1.
Gene Expression of Putative Lipase Genes under Heat Stress.
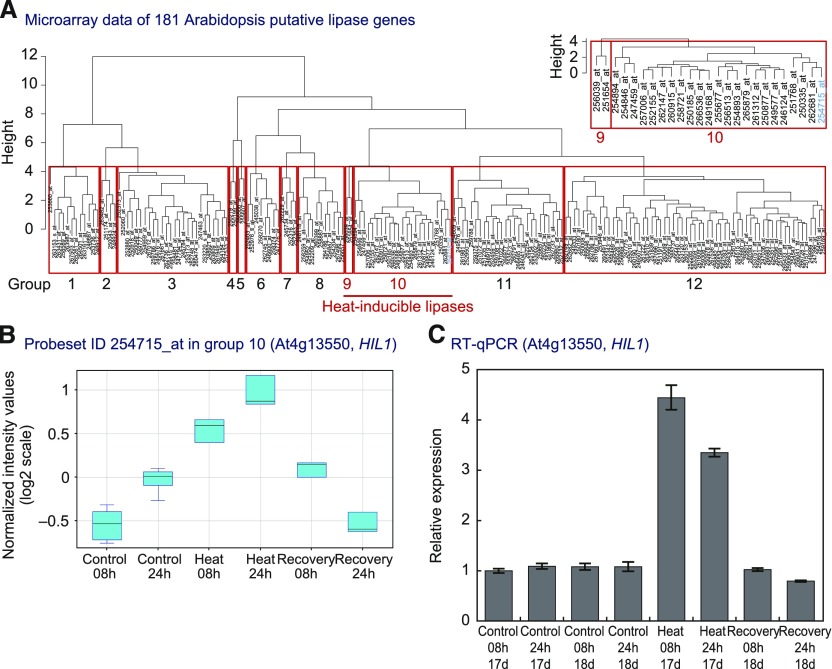
(A) A tree diagram shows the similarity of expression patterns among the 181 Arabidopsis putative lipase genes under different heat stresses. Previous GeneChip data were used for the analysis (Higashi et al., 2015). Hierarchical clustering analysis classified the genes into 12 groups (red lines). Groups 9 and 10 (red font, enlargement in inset) contain genes (probe set IDs) induced by heat stress and returned to normal levels during temperature recovery (see Table 1 for detail).
(B) Microarray data of a heat-inducible lipase (At4g13550, HIL1), which belongs to group 10 (blue font, “254715_at”) in (A). Each data point was represented by a box and whisker plot (biological replicates of n = 3 to 9).
(C) The transcript levels of HIL1 were quantified by RT-qPCR. The y axis represents the relative expression level of HIL1 against “Control 08 h 17 d” calculated by the comparative CT (ΔΔCT) method. RNA content was normalized by EIF4A1 as an internal standard. Each data point expresses the mean of three experiments ± sd. The whole rosettes harvested from two to three different plants were pooled as one biological repeat.

