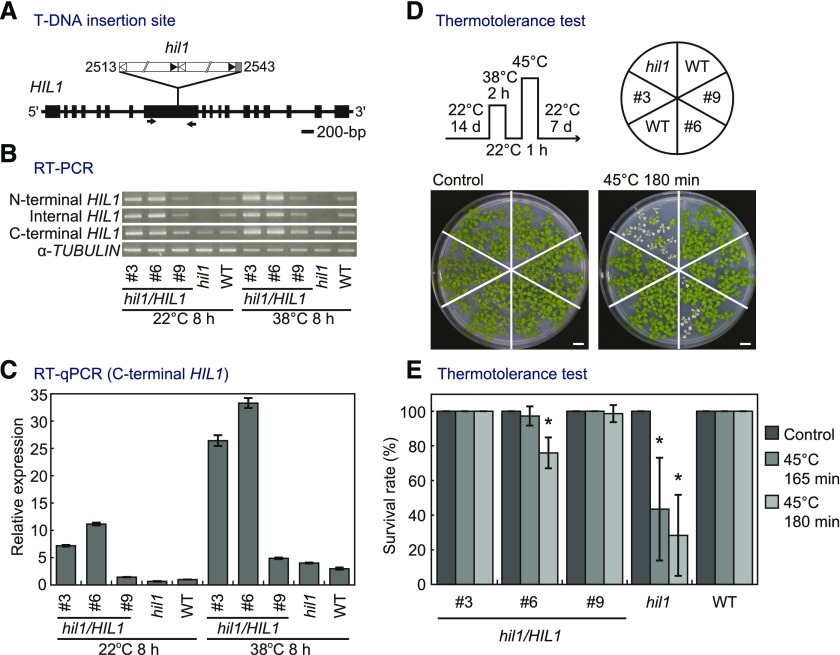
Figure 4.
Genomic Organization of the hil1 T-DNA Insertion Line, and the Impact of Insertional Mutation and Its Genetic Complementation on HIL1 Expression Levels and Thermotolerance.
(A) Schematic representation of HIL1 (At4g13550) with a T-DNA insertion mutant (hil1) used in this work. Exons are shown as boxes. White and black triangles show left and right borders, respectively. Numbers indicate the position of the T-DNA insertion from the start codon of HIL1. The arrows indicate primers used for RT-PCR (internal HIL1) in (B).
(B) RT-PCR analysis of HIL1 transcripts in the wild-type plants (WT), hil1 mutant, and hil1 complemented with the genomic sequence of HIL1 (hil1/HIL1 #3, #6, and #9 T3 lines). Total RNA was extracted from the whole rosettes of 17-d-old plants under heat stress conditions at 38°C for 8 h (38°C 8 h). As a control, plants not subjected to the stress but grown under normal conditions at 22°C were examined at the same time point (22°C 8 h). HIL1 expression levels were examined at the N-terminal, internal (interrupted by the T-DNA insertion), and C-terminal regions. α-TUBULIN was used as the control.
(C) RT-qPCR of HIL1 transcripts in the wild type, hil1, hil1/HIL1 #3, #6, and #9. The y axis represents relative expression level of HIL1 against 22°C 8 h WT calculated by the comparative CT (ΔΔCT) method. RNA content was normalized by EIF4A1 as an internal standard. Each data point expresses the mean of three experiments ± sd. The whole rosettes harvested from two to three different plants were pooled as one biological repeat. Primers were designed at the C-terminal region of HIL1, which is located downstream of the T-DNA insertion site.
(D) and (E) The effects of heat shock on growth of the wild-type, hil1 mutant, and hil1/HIL1-complemented plants (#3, #6, and #9 T4 lines). Fourteen-day-old plants were treated at 38°C for 2 h, 22°C for 1 h, and 45°C for 165 or 180 min (45°C 165 min and 45°C 180 min), followed by recovery at 22°C for 7 d. Plants grown continuously at 22°C were examined as the normal growth condition (Control). Photographs of the whole rosettes were taken after the recovery periods (D). Survival rate was calculated based on the number of plants surviving after recovery (E). Each data point expresses the mean of more than four experiments ± sd. Significant differences from the wild-type plants were analyzed using Welch’s t test (*P < 0.001). Bars = 1 cm.

