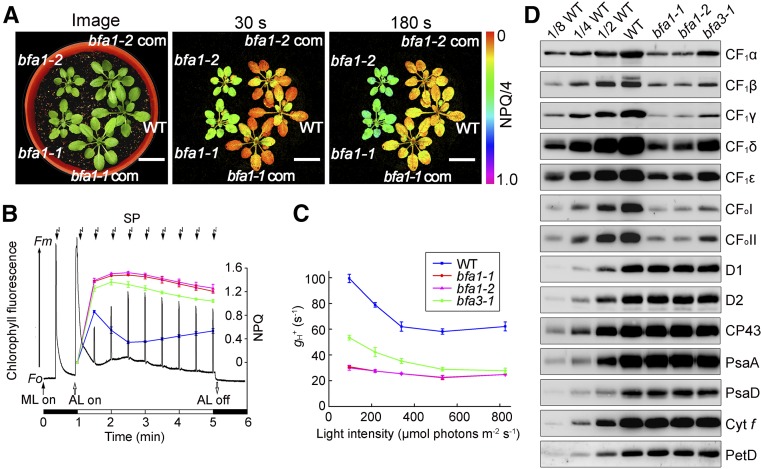
Figure 1.
Accumulation of Chloroplast ATP Synthase Is Reduced in bfa1.
(A) Growth and high-NPQ phenotypes of the bfa1 mutants. An image of 4-week-old plants is shown in the left panel. Dark-adapted plants were illuminated at 80 μmol photons m–2 s–1, and the images of NPQ were captured following illumination for 30 s or 180 s. bfa1-1 com and bfa1-2 com are bfa1 mutants complemented with the wild-type (WT) BFA1 genomic sequence. Bars = 2 cm.
(B) Analysis of NPQ induction upon illumination with actinic light (AL; 80 μmol photons m–2 s–1). The black trace indicates a typical trace of chlorophyll fluorescence in wild-type plants. NPQ levels (colored lines) were calculated during saturating light pulses (SP; 3000 μmol photons m−2 s−1 for 0.8 s, black arrows at top). ML, measuring light; F0, minimal chlorophyll fluorescence; Fm, maximum chlorophyll fluorescence. Means ± sd (n = 3 biological replicates from independent plants).
(C) Analysis of the H+ conductivity through ATP synthase (gH+). gH+ was measured according to the fast decay kinetics of the electrochromic shift signal recorded in detached leaves following illumination at various light intensities. Means ± sd (n = 3 biological replicates from independent plants).
(D) Immunoblot analysis of the thylakoid proteins. Thylakoid protein extracts from wild-type, bfa1-1, bfa1-2, and bfa3-1 plants were loaded on an equal chlorophyll basis.

