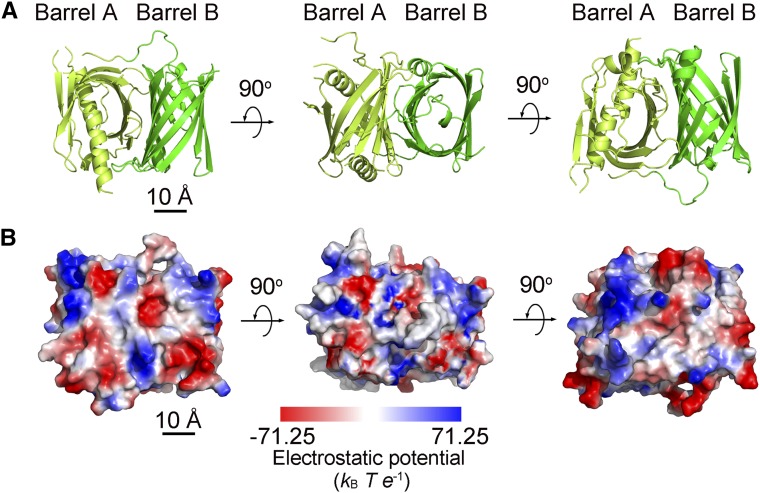
Figure 7.
Crystal Structure of BFA1.
(A) Overall structure of BFA1 in ribbon representation. The N-terminal β-barrel (Barrel A) is in light green, and the C-terminal β-barrel (Barrel B) is darker green. Bar = 10 Å.
(B) Electrostatic potential surface of BFA1 as viewed in (A). Positively and negatively charged patches are colored in blue and red, respectively. Three views are presented with a 90° rotation along the horizontal axis. The bar at the bottom shows the color scale of the electrostatic potential surface, which was generated by PyMOL software. Bar = 10 Å.

