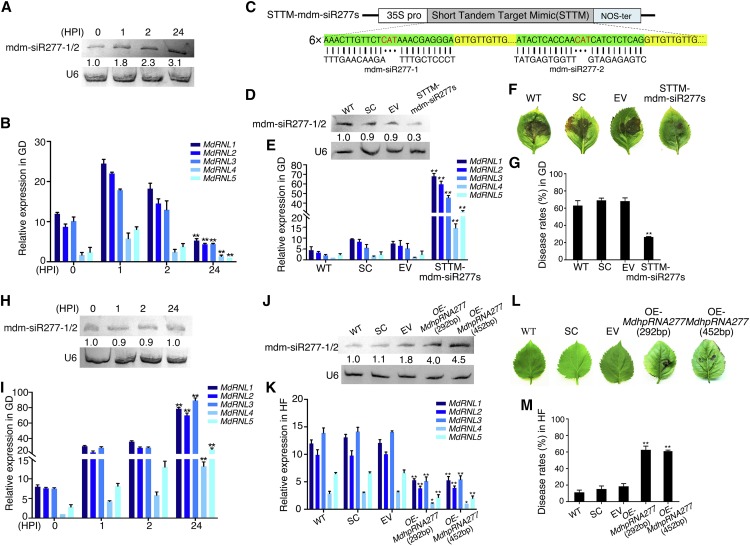
Figure 2.
mdm-siR277-1/2 Affects ALT1 Susceptibility in Apple by Regulating the Expression of Five R Genes.
(A) mdm-siR277-1/2 content in ALT1-inoculated GD plantlets, as revealed by RNA gel blot analysis. U6 was probed as a loading control. The signals were quantified, and relative abundances are shown below the blots.
(B) RT-qPCR showing the expression levels of five mdm-siR277-1/2 target genes in ALT1-inoculated GD plantlets. The numbers on the x axis indicate HPI.
(C) Schematic of constructs used to silence mdm-siR277-1/2 (STTM-mdm-siR277s) via Agrobacterium-mediated transient expression.
(D) mdm-siR277-1/2 content 4 d after agroinfiltration, as revealed by RNA gel blot analysis.
(E) RT-qPCR showing the mRNA levels of five target genes in mdm-siR277-1/2-silenced GD plantlets 48 h after ALT1 inoculation.
(F) Disease symptoms in GD leaves in which mdm-siR277-1/2 is silenced at 48 h after ALT1 inoculation.
(G) Disease rates in GD leaves in which mdm-siR277-1/2 is silenced at 48 h after ALT1 inoculation. In (D) to (G): WT, noninfiltrated GD plantlets; SC, scratch controls; EV, pFGC5941 empty vector; STTM-mdm-siR277s, GD plantlets with silenced mdm-siR277-1/2.
(H) mdm-siR277-1/2 content in ALT1-inoculated HF plantlets, as revealed by RNA gel blot analysis.
(I) RT-qPCR showing the expression levels of five mdm-siR277-1/2 target genes in ALT1-inoculated HF plantlets.
(J) mdm-siR277-1/2 content 4 d after agroinfiltration, as revealed by RNA gel blot analysis.
(K) The mRNA levels of five target genes, as revealed by RT-qPCR in mdm-siR277-1/2-overexpressing HF leaves 48 h after ALT1 inoculation.
(L) Phenotypes of HF leaves overexpressing mdm-siR277-1/2 at 48 h after ALT1 inoculation.
(M) Disease rates in HF leaves overexpressing mdm-siR277-1/2 at 48 h after ALT1 inoculation. In (J) to (M): WT, noninfiltrated HF plantlets; SC, scratch controls; EV, pFGC5941 empty vector; OE-MdhpRNA277 (452 bp), HF plantlets overexpressing whole transcript MdhpRNA277 (452 bp); OE-MdhpRNA277 (292 bp), HF plantlets overexpressing truncated transcript MdhpRNA277 (292 bp). Spore inoculum concentration: 2 × 10⁵ cfu/mL. Spore growth was measured at 6 DPI. Error bars represent standard deviations calculated from three biological replicates (separate biological material). Student’s t test: **P < 0.01 and *P < 0.05.

