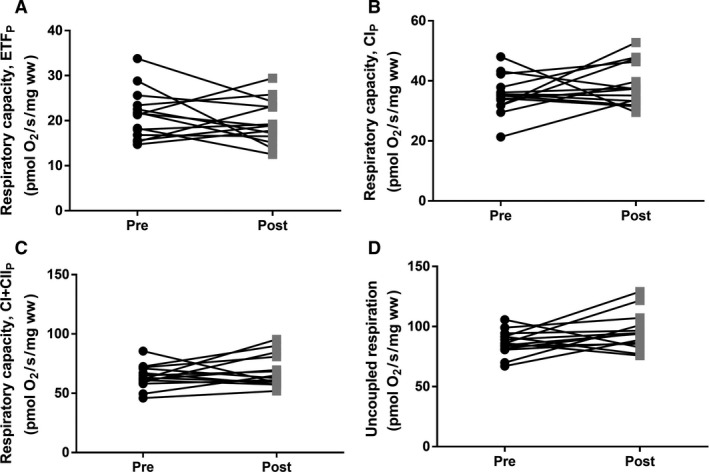
Figure 2.

Mitochondrial respiratory capacity before and after 4 days bed rest. (A) Maximal mitochondrial lipid respiratory capacity (ETFP). (B) Mitochondrial respiratory capacity with complex I linked substrates (CIP). (C) Maximal mitochondrial respiratory capacity with complex I‐ and II‐linked substrates (CI + IIP) (D) Uncoupled respiration. Data are mean ± SD. Black circles represents prebed rest; gray squares represents postbed rest.
