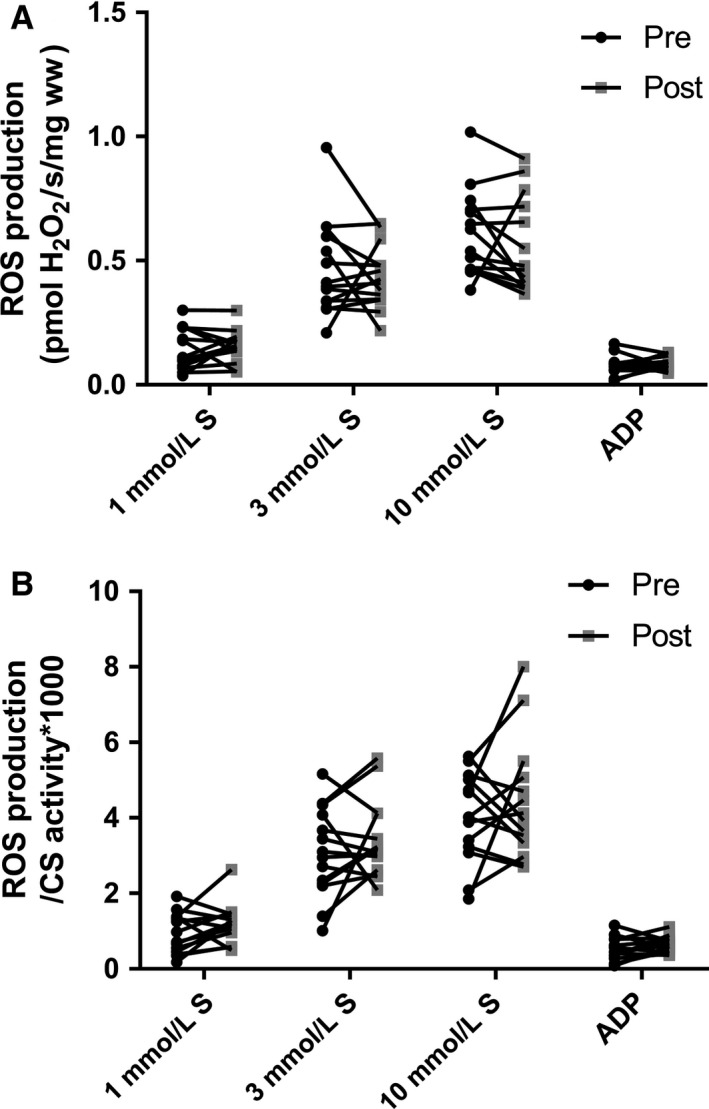
Figure 4.

Mitochondrial H2O2 production before and after 4 days bed rest. (A) Succinate (1, 3 and 10 mmol/L) and ADP (5 mmol/L) induced H2O2 production in permeabilized muscle fibers (B) H2O2 production from panel A normalized to CS activity. Data are mean ± SD. Black circles represents pre bed rest; gray squares represents post bed rest.
